In this article, we will be looking at some crucial tips that are essential to speed your website load time by measuring your disk activity.
What is the Reason behind a slow website?
The user needs to send a request in order to access any information from the server. At the server-side, the information resides on the files which are stored in Hard Disk Drives (HDDs) or more preferably to the disks. Then, the disk starts rotating to get to the required disk sector for reading the user requests. Meanwhile, when the processor waits for the file to revert back, the process leads to waiting time about a few milliseconds.
Such an access time adds up to the processing of the heavy data servers as they have to proceed innumerable data requests and therefore, it becomes a performance bottleneck for retrieving the data from the storage device. Hence, for preventing the app performance from the disk latency, it becomes important to keep an eye on your disk usage along with the I/O to check out the best core functionalities of your app. Let us begin with some simple terms.
What is Disk I/O?
Disk I/O includes all of the read and write operations and defines the speed at which the data transfer needs to take place between the RAM and hard disk drive. In basic terms, Disk I/O is used to measure an active disk time and is used as a measure of performance to distinguish between the storage devices, for instance – HDDs, SSDs, and SAN. This allows you to monitor the Read and Write operations on your system and set the limits to get alerted every time you reach the max level.
Monitor disk I/O on Linux servers
Using IOSTAT and IOTOP commands
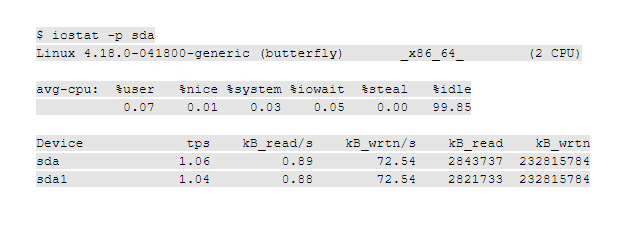
At first, you need to type the top command in your terminal for checking the server load and if the outcomes are low, then go for wa status to know more about the Read and Write IOPS in your hard disk. If the output is positive, then check I/O activity in the Linux box by using iostat or iotop commands. You can monitor the disk utilization with the help of an individual process by making use of the iotop command whereas the iostat allows monitoring your I/O device load time. Sometimes, it is used to evaluate the balance of the disk activities.
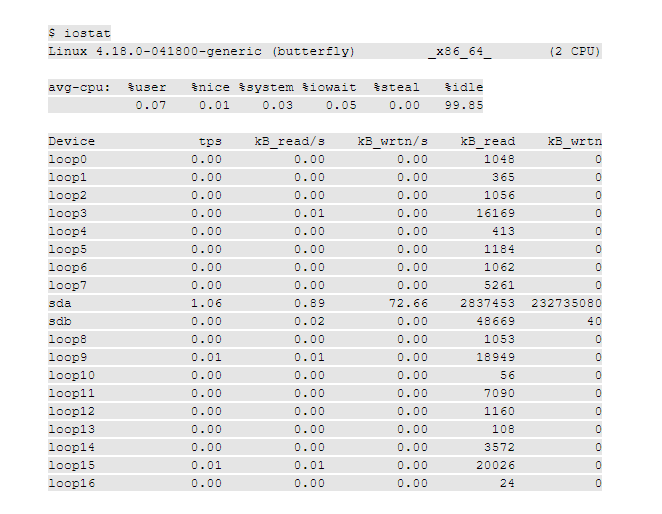
It is obvious on your Linux loop devices that the stats provided help you clutter the display when you only want to focus on disks. Take a look at the command given below that does not provide -p option for monitoring the disks.
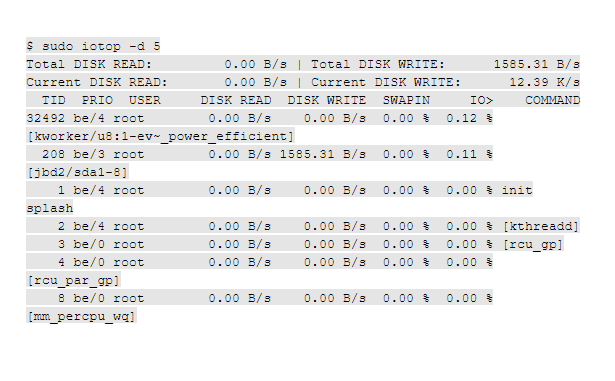
The iotop command is the top-utility while looking at the disk I/O by gathering all the usage information through the Linux kernel and get you an idea of the most demanding terms in your disk I/O. Look at the given example to check out when the loop time has been set to 5 seconds. The display will get updated by itself and overwrites the output.
atop and ioping commands
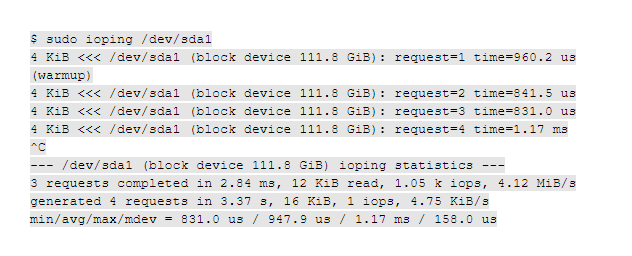
The ioping command is an altogether variant type of tool, but it can report disk latency by letting you know how long it takes for a disk to respond your requests and help in identifying the disk problems.
The atop command is similar to the top that provides a lot of information on system performance by including some of the stats on your disk activity.
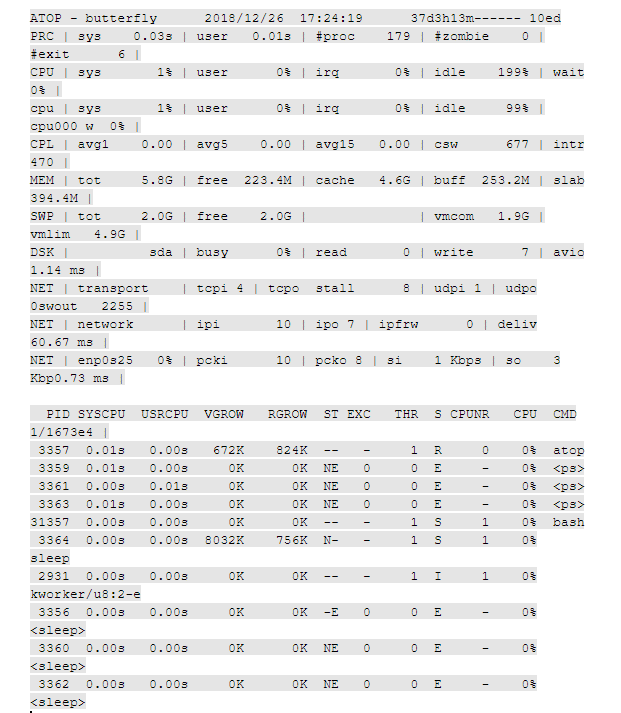
Also, you can easily manage the disk stats, it can happen by making use of the command in a similar way.
dtstat command
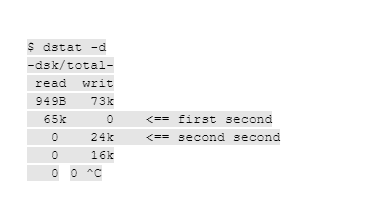
This command offers stats on a lot more than just disk activity. Thus, if you wish to view your disk activity, it is recommended to make use of the -d option. You will get a continuous list of disk read/write measurements as shown down until you stop it getting displayed with a ^c. Also, it should be noted here that after every subsequent row, you will need to report the disk activity within the following time interval where the default is just set to one second.
Wrap Up
Here, we come to the end of the article. We hope one of these commands will tell you what you need to know when it comes to disk performance. Frequent use of these commands will allow you to get an accurate insight behind the specific busy or slow disk which you are supposed to check. Till then – Keep Learning!