Creating Charts using JavaScript and PHP
Web based chart can be created by using any client-side library or server-side library based on static or dynamic data. If you want to create animated charts and want to download the chart faster then it is better to use a client-side chart library. Many client-side libraries are available to create charts for web pages. One of the popular client-side libraries is CanvasJS which can be used to create web based charts by using fixed data or retrieving data from any database.
CanvasJS is used with PHP in this tutorial for creating web based charts. This library supports various types of charts, such as bar chart, column chart, dynamic column chart, line chart, pie chart, pyramid chart, doughnut chart, bubble chart etc. Some of them are shown here by using sample data. Before starting this tutorial, you must ensure that your web server and PHP are installed properly and working.
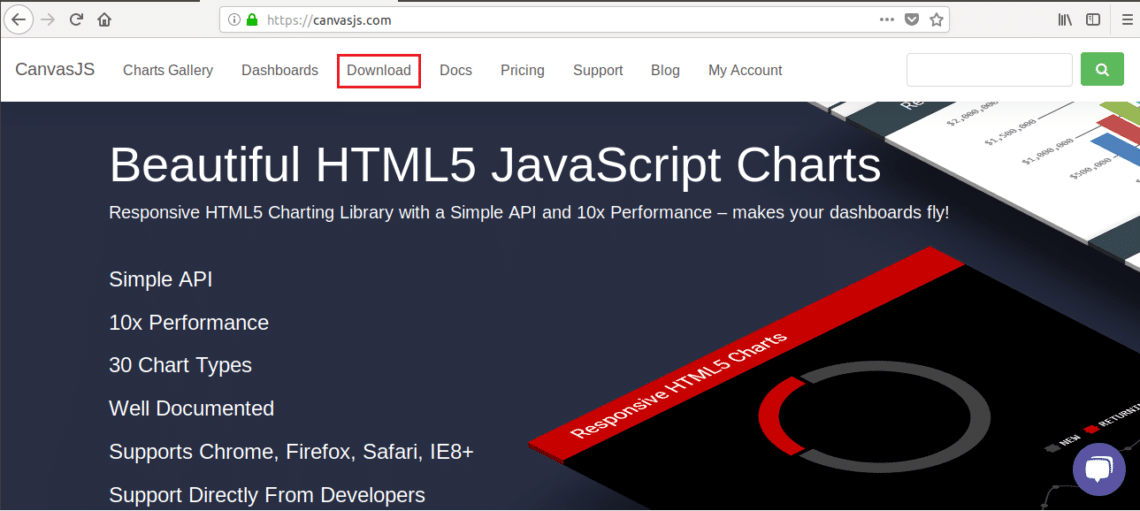
Download CanvasJS
It is available in free and commercial version. You can download and use the free version of this library for testing purposes. Go to the following URL and click on Download link to download CanvasJS library. Unzip the file and store the folder in web server after download to use it.
$profitdata = array(
array("x"=> 2013, "y"=> 440000),
array("x"=> 2014, "y"=> 270000),
array("x"=> 2015, "y"=> 210000, "indexLabel"=> "Lowest"),
array("x"=> 2016, "y"=> 600000),
array("x"=> 2017, "y"=> 630000, "indexLabel"=> "Highest"),
array("x"=> 2018, "y"=> 560000) );
?>
<html>
<head>
<script src="http://localhost/canvasjs/canvasjs.min.js"></script>
<script>
window.onload = function () {
var chart = new CanvasJS.Chart("displaychart", {
//Enable animation
animationEnabled: true,
//To save the chart as image
exportEnabled: true,
//The others values of theme are "light1", "light2", "dark1"
theme: "dark2",
title:{
text: "Yearly Profits"
},
data: [{
//Change type to bar, line, pie etc. to change the display
type: "column",
indexLabelFontColor: "#5A3457",
indexLabelPlacement: "outside",
//Read data from PHP array in JSON format
dataPoints: <?php echo json_encode($profitdata, JSON_NUMERIC_CHECK); ?>
}]
});
chart.render();
}
</script>
</head>
<body>
<center>
<h3>Column Chart Example </h3>
<div id="displaychart" style="height: 70%; width: 40%; align:center;"></div>
</center>
</body>
</html>
Output:
The following output will be generated if you run the file from any web server. “Trial Version“ and “CanvasJS.com” watermarks will be shown for free version.
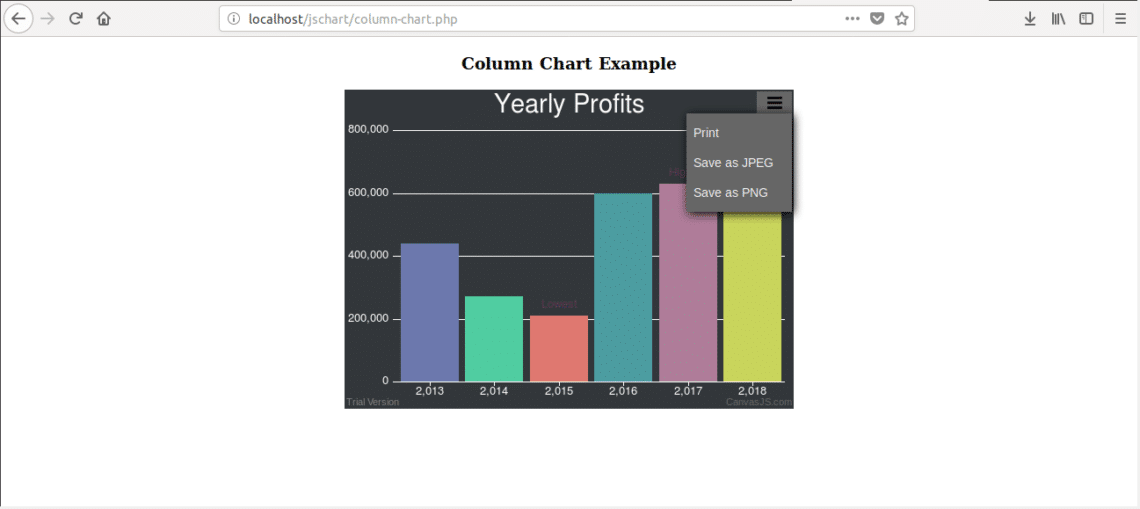
When you click on “More Options” button from top right corner then three options will be shown. You can print the chart or save the chart as JPG or PNG image format. If you click on “Save as PNG” option then the following dialog box will appear.
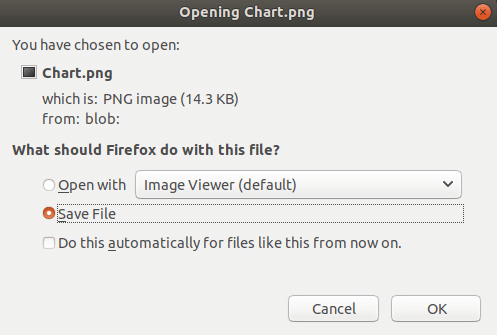
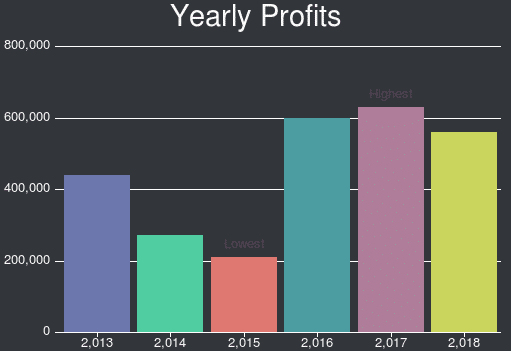
The default image file name is Chart.png. You can remove the watermarks from the image by using any photo editing software easily.
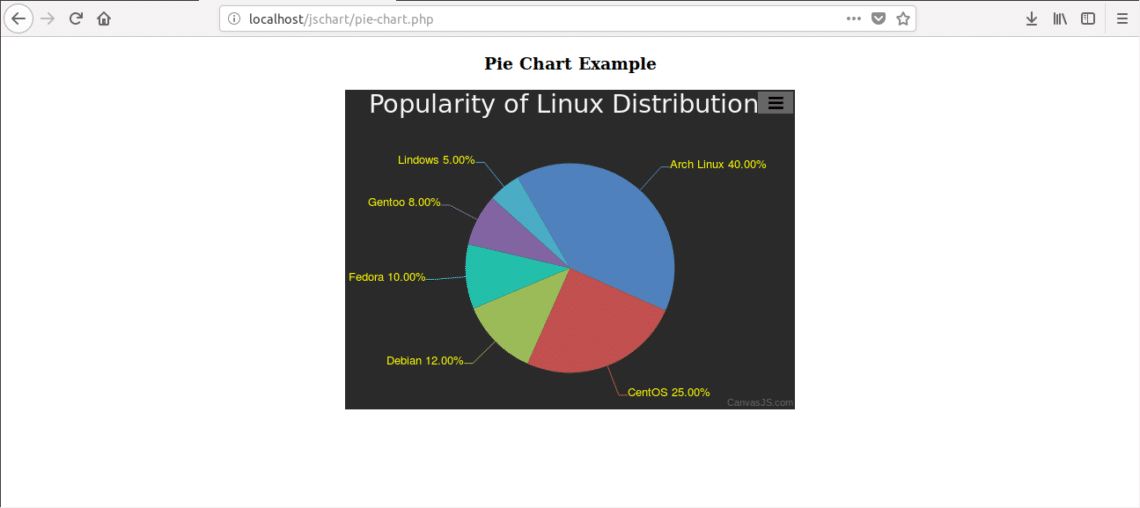
Pie Chart:
The following example shows the popularity of different Linux distributions using pie chart. Write the following code in a file named pie-chart.php and store the file in var/www/html/jschart folder.
$popularity = array(
array("os"=> "Arch Linux", "y"=> 40),
array("os"=> "CentOS", "y"=> 25),
array("os"=> "Debian", "y"=> 12),
array("os"=> "Fedora", "y"=> 10),
array("os"=> "Gentoo", "y"=> 8),
array("os"=> "Lindows", "y"=> 5)
);
?>
<html>
<head>
<script src="http://localhost/canvasjs/canvasjs.min.js"></script>
<script>
window.onload = function () {
var chart = new CanvasJS.Chart("displaychart", {
//Enable animation
animationEnabled: true,
//To save the chart as image
exportEnabled: true,
//The others values of theme are "light1","dark1", "dark2"
theme: "dark1",
title:{
text: "Popularity of Linux Distributions"
},
data: [{
//Change type to bar, line, column etc. to change the display
type: "pie",
//Set font color for the label
indexLabelFontColor: "yellow",
//format the percentage values
yValueFormatString: "##0.00’%’",
//Set angle for pie
startAngle: 240,
indexLabel: "{os} {y}",
//Read data from PHP array in JSON format
dataPoints: <?php echo json_encode($popularity, JSON_NUMERIC_CHECK); ?>
}]
});
chart.render();
}
</script>
</head>
<body>
<center>
<h3>Pie Chart Example </h3>
<div id="displaychart" style="height: 70%; width: 40%;"></div>
</center>
</body>
</html>
Output:
The following output will display if you run the file from web server. You can create image file of the chart by the step which is shown in the previous example.
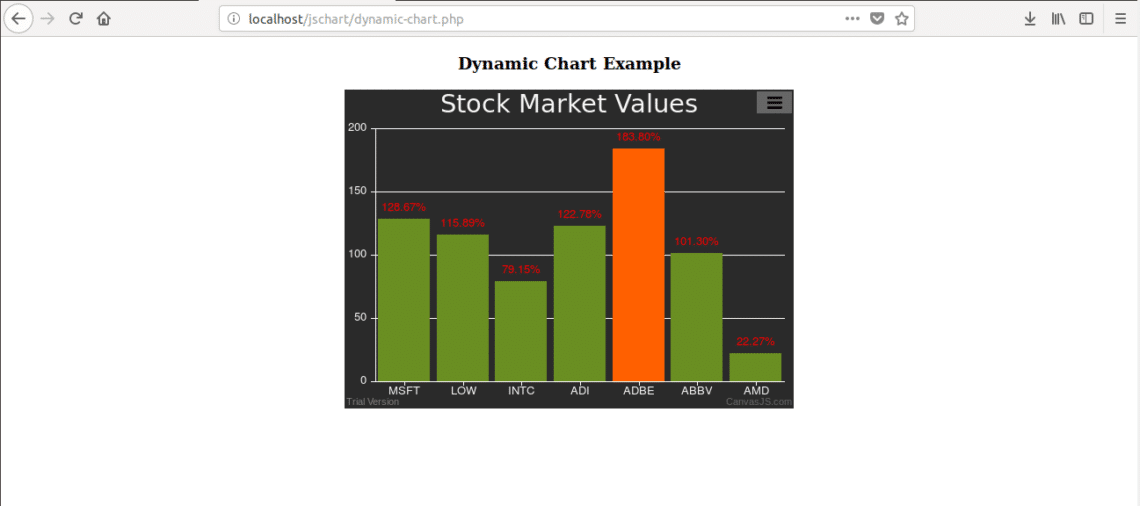
Dynamic Column Chart:
You can create nice looking dynamic chart by using this library. Suppose, you want to create live chart of stock market where stock price increases or decreases continuously. Write the following code in a file named dynamic-chart.php and store the file in var/www/html/jschart folder.
$stockdata = array(
array("stock"=> "MSFT", "y"=> 92.67),
array("stock"=> "LOW", "y"=> 88.89),
array("stock"=> "INTC", "y"=> 52.15),
array("stock"=> "ADI", "y"=> 91.78),
array("stock"=> "ADBE", "y"=> 224.80),
array("stock"=> "ABBV", "y"=> 94.30),
array("stock"=> "AMD", "y"=> 10.27)
);
?>
<html>
<head>
<script src="http://localhost/canvasjs/canvasjs.min.js"></script>
<script>
window.onload = function () {
var chart = new CanvasJS.Chart("displaychart", {
//Enable animation
animationEnabled: true,
//To save the chart as image
exportEnabled: true,
//The others values of theme are "light1","dark1", "dark2"
theme: "dark1",
title:{
text: "Stock Market Values"
},
data: [{
//Change type to bar, line, column etc. to change the display
type: "column",
//Set font color for the label
indexLabelFontColor: "red",
//format the percentage values
yValueFormatString: "##0.00’%’",
indexLabel: "{y}",
//Read data from PHP array in JSON format
dataPoints: <?php echo json_encode($stockdata, JSON_NUMERIC_CHECK); ?>
}]
});
//Read stock names
var stdata = chart.options.data[0].dataPoints;
var st = new Array();
for (var i = 0; i < stdata.length; i++) {
st[i]= stdata[i].stock;
}
function updateChart() {
var stockColor, deltaY, yVal, xVal;
var dps = chart.options.data[0].dataPoints;
for (var i = 0; i < dps.length; i++) {
deltaY = Math.round(2 + Math.random() *(–2–2));
yVal = deltaY + dps[i].y > 0 ? dps[i].y + deltaY : 0;
xVal = dps[i].stock;
stockColor = yVal > 200 ? "#FF2500" : yVal >= 170 ? "#FF6000" : yVal < 170 ? "#6B8E23 "
:null;
dps[i] = {label: st[i], y: yVal, color: stockColor};
}
chart.options.data[0].dataPoints = dps;
chart.render();
};
updateChart();
setInterval(function() {updateChart()}, 500);
}
</script>
</head>
<body>
<center>
<h3>Dynamic Chart Example </h3>
<div id="displaychart" style="height: 70%; width: 40%;"></div>
</center>
</body>
</html>
Output:
The following output will display if you run the file from web server. You can create image file of the chart by similar way which is shown in the first example.
By following above steps, you can easily create necessary web based animated charts using this useful JavaScript library.