We can use htop command to see a list of all the running processes of our Linux server. But what if we want to monitor how much disk bandwidth each of these processes are consuming? Well, we can use iotop.
iotop is an interactive I/O monitoring tool on Linux just like htop. With iotop, you can easily monitor disk read and write bandwidth usage for each running processed on Linux.
In this article, I am going to show you how to install iotop on popular Linux distributions and how to use iotop to monitor disk read and write bandwidth usage per running process. I will be using Ubuntu 18.04 LTS for the demonstration, but the same commands should work on any modern Linux distributions. So, let’s get started.
Installing iotop on Ubuntu:
iotop is available in the official package repository of Ubuntu. So, you can easily download iotop using the APT package manager.
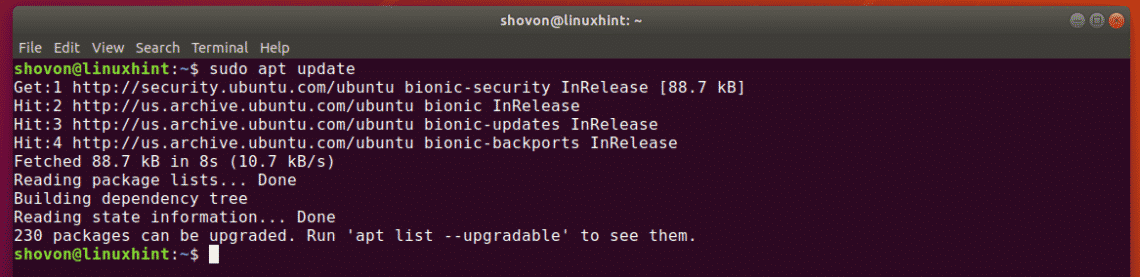
First, update the APT package repository cache with the following command:
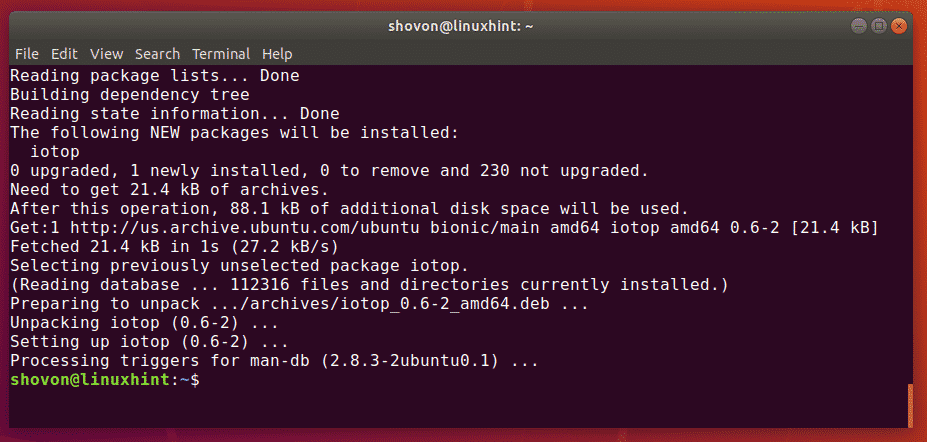
Now, install iotop with the following command:

iotop should be installed.
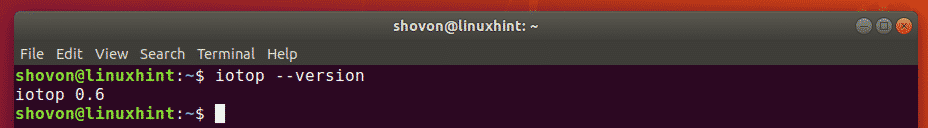
Now, check whether iotop is working with the following command:
iotop is working as you can see.
Installing iotop on CentOS 7:
iotop is available in the official package repository of CentOS 7. You can easily install it with the YUM package manager as follows:

Basic Usage of iotop:
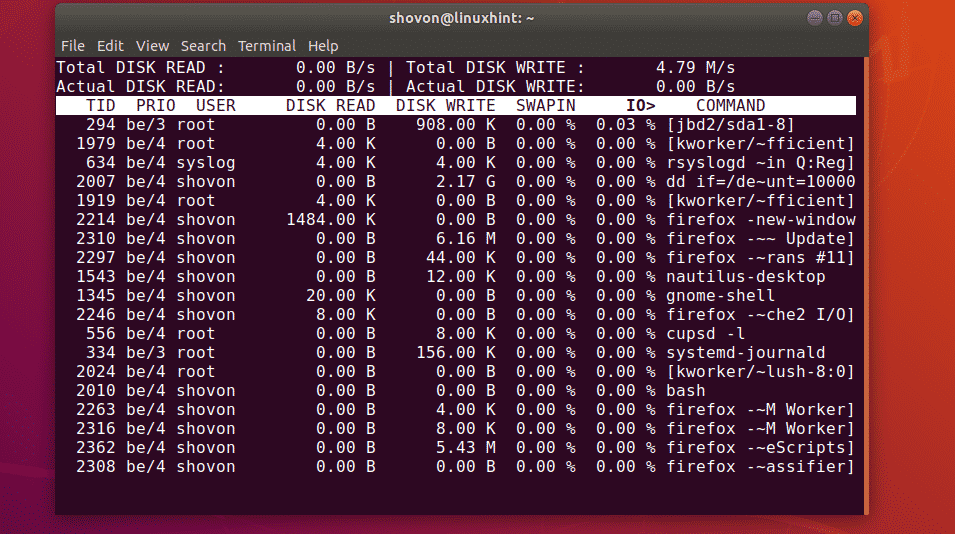
To monitor the disk usage of each running processes with iotop, run iotop as follows:

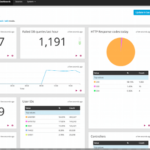
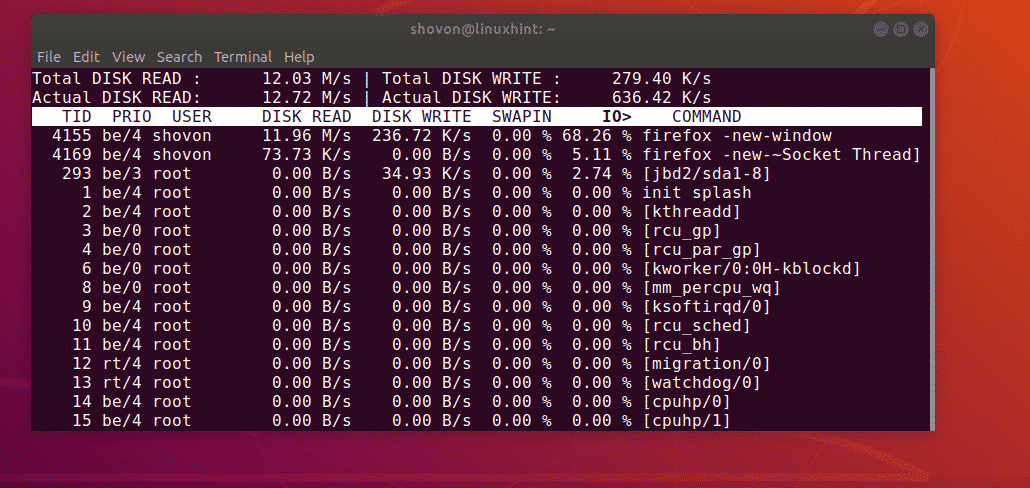
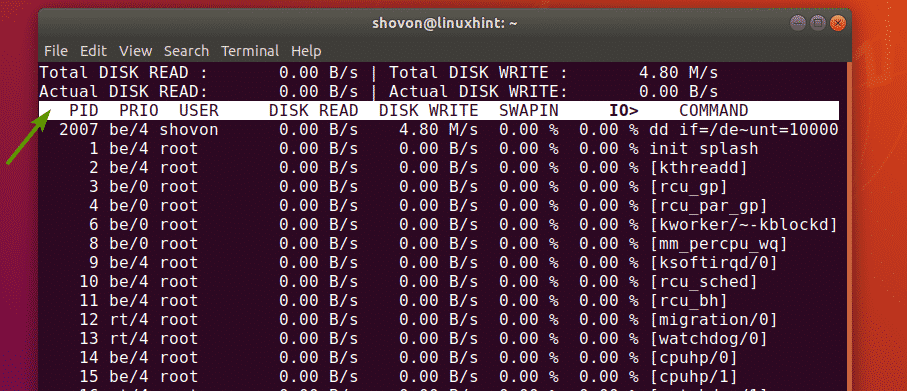
As you can see, the iotop interactive window is opened. Here, you can see which process is using the disk.
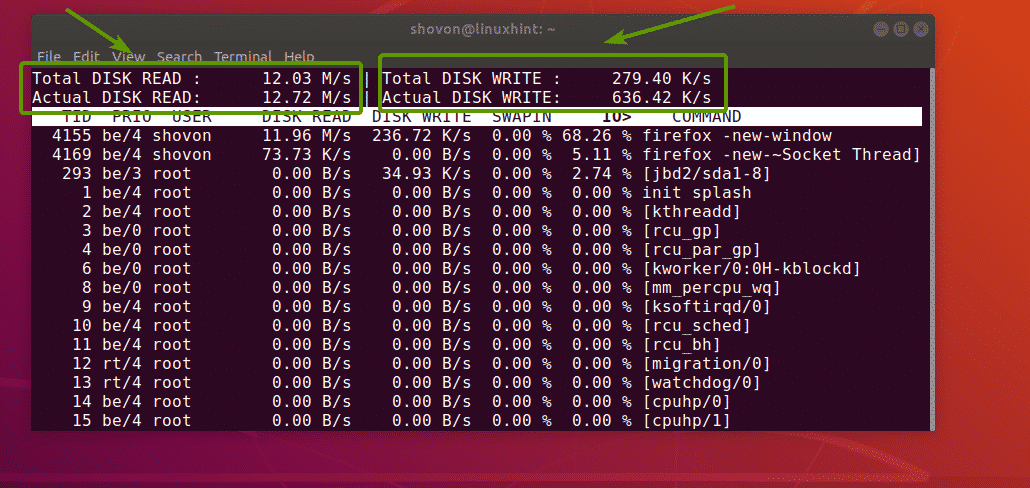
As you can see on the screenshot below, on the top left side, the total disk read speed/bandwidth is displayed. The same way, on the top right side, the total disk write speed/bandwidth is displayed.
As you can see, iotop displays columns for,
- Thread ID (TID).
- I/O Priority class/level (PRIO).
- the owner of the thread with TID (USER).
- the disk read per second (DISK READ).
- the disk write per second (DISK WRITE).
- the percentage of time the thread spent while swapping in (SWAPIN).
- the percentage of time the thread spent waiting on I/O (IO>).
- the command the thread is running (COMMAND).
For most of the cases, the Thread ID (TID) is equivalent to Process ID (PID).
Displaying Processes Doing I/O Operations Only:
By default, iotop shows all the running processes whether they are doing I/O operations or not. So, the list is very long. It is harder to find the processes we need and monitor them.
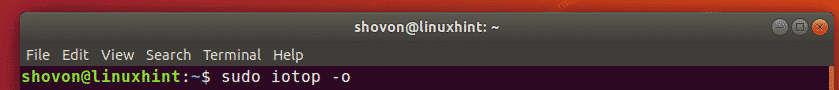
Luckily, iotop lets you display only the processes that are doing I/O operations. To do that, you can use the -o or –only option of iotop.
To display only the processes doing I/O operations, run iotop as follows:
Or
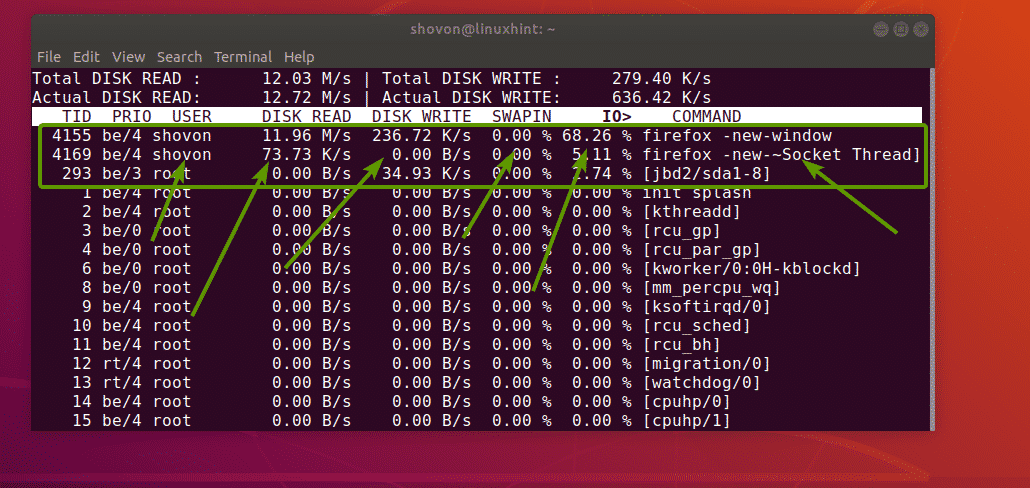
As you can see, the process with TID 1345 and 1957 are doing I/O operations right now.
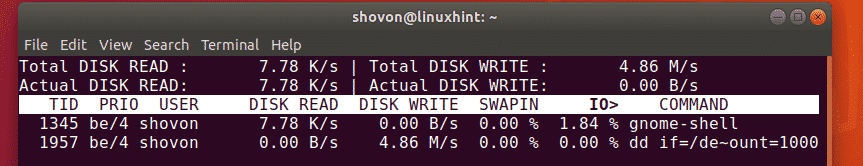
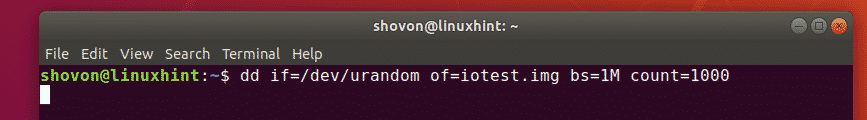
This is the command that I am running to simulate I/O operations in this article.
NOTE: If you haven’t started iotop with the -o or –only option, you can still switch to this mode by pressing the o key on your keyboard. You can toggle between these 2 modes of iotop using the o key.
Displaying Total I/O Usage Per Process:
iotop also lets you monitor how much disk reads and disk writes in total each processes have done after iotop started as well. To do that, you have to use the -a or –accumulated option. You can also use it with the -o or –only option as well.
For example,
As you can see, the total disk reads and disk writes per process is displayed.
Displaying PID instead of TID:
As I’ve stated earlier, Thread ID (TID) is the same as Process ID (PID) most of the time. You can use these interchangeably. But if you really want to be sure that you’re working with exactly process ID (PID), then iotop has the -P or –processes option that you can use to change the default TID column to PID column.
To display PID column instead of TID column, run iotop as follows:
Or
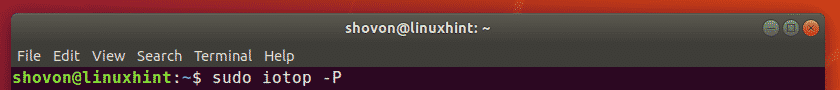
As you can see, the TID column is replaced by the PID column.
Filtering iotop Processes:
You can filter iotop processes based on process ID (PID), thread ID (TID) and the processed owner (USER).
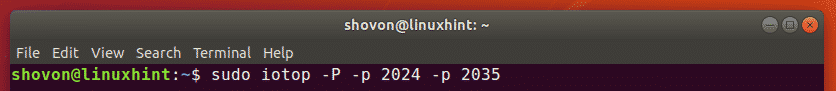
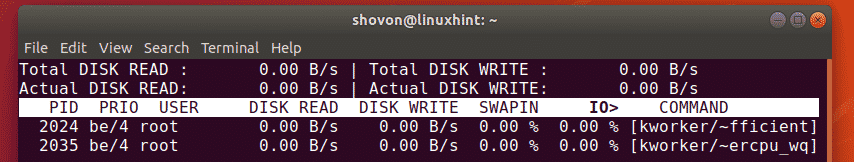
For example, if you want to monitor the disk I/O of the processes with the PID 2024 and 2035 only, you would run iotop as follows:
As you can see, only the processes with the PID 2024 and 2035 are being monitored.
If you wanted to monitor the disk I/O of the threads with the TID 2024 and 2035 only, you would run iotop as follows:
Again, let’s say, you want to monitor the disk I/O of the processes running as the user shovon. To do that, run iotop as follows:
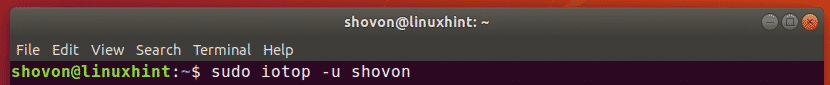
As you can see, only the processes running as the user shovon is displayed.

If you want to monitor multiple users at once, you can do that as well.
For example, to monitor disk I/O of all the processes that the users shovon and lily are running, run iotop as follows:
So, that’s basically how you use iotop to monitor disk I/O in Linux. Thanks for reading this article.