PyCharm and Debugging
While many of us dread writing codes in the first place, several others find debugging a more frustrating task out of all. It is more time-consuming in Python since you don’t know where the bug is. Luckily, with PyCharm and its significant debugging features, users can engage in a unique debugging experience when running their python scripts.
Find out how through a detailed tutorial below:
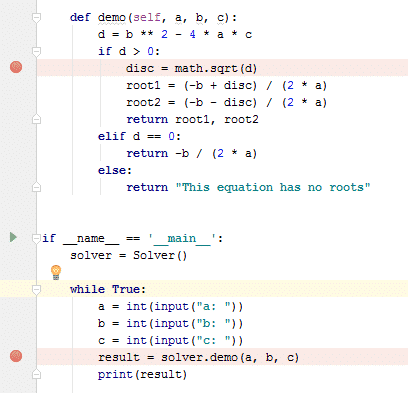
To see how debugging works in PyCharm, let’s take a sample code snippet. Remember, you will have to run the script first and then start with debugging errors.
Create a new project and then a new file into it. Now, type the following code into the file.
class Solver:
def demo(self, a, b, c):
d = b ** 2 – 4 * a * c
if d > 0:
disc = math.sqrt(d)
root1 = (-b + disc) / (2 * a)
root2 = (-b – disc) / (2 * a)
return root1, root2
elif d == 0:
return -b / (2 * a)
else:
return "This equation has no roots"
if __name__ == ‘__main__’:
solver = Solver()
while True:
a = int(input("a: "))
b = int(input("b: "))
c = int(input("c: "))
result = solver.demo(a, b, c)
print(result)
Breakpoints and How to Place them
Breakpoints are markers that help you suspend execution of your program at any specific point so you can examine the errors and behaviour of that particular line. Once marked, a breakpoint will remain in your code unless you explicitly remove it. To place them, click on the left gutter next to the line you want to suspend the application at.
For example:
How to Start Debugging?
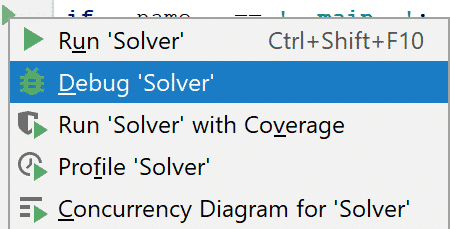
Once you’re done adding breakpoints, your code is ready for debugging. The debugger will run the entire program except for the lines you have explicitly marked not to. To start the debugger session, click the ‘green play icon’ in the left. When a popup menu appears, select the option, ‘Debug Solver’. (Solver, because that’s the name of the file.)
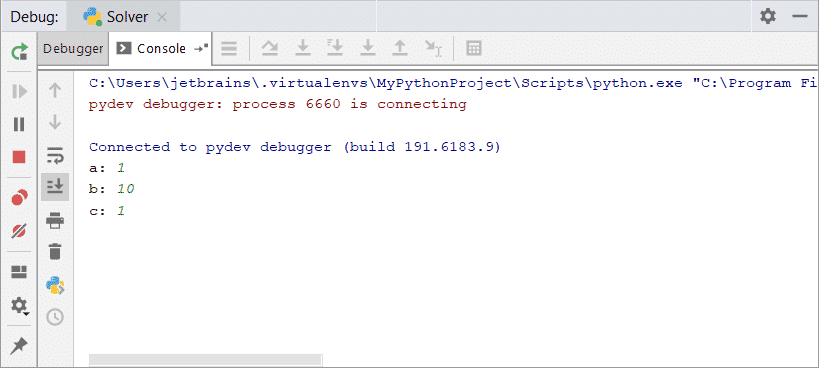
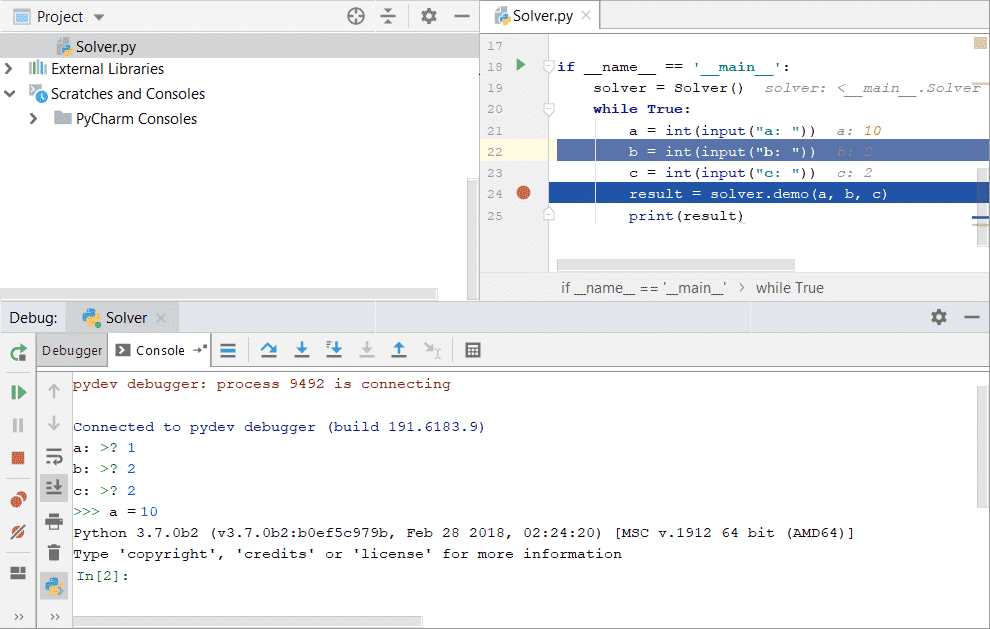
When the debugger starts, your program begins to execute in a Console Tab of the Debug Window. Since the program required input values, the debugger screen will ask you to do that below:
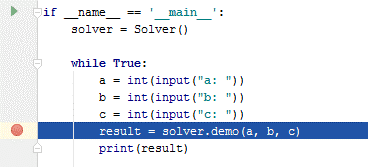
At the first breakpoint, the debugger suspends the program highlighting the line in blue:
To resume the debugging, click the ‘green play icon’ on top of the Debugger tab toolbar.
The concept of Inline Debugging
Inline debugging lets you view each variable’s value so to make the debugging process easier and more understandable. This feature is present by default in PyCharm. You can also turn it off from here.
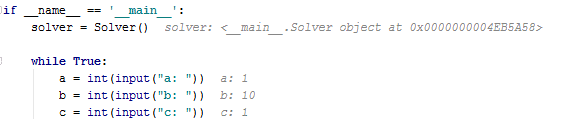
The above image shows the grey text next to each line of code. These also display both the values and description of the code.
Moving forward
After stopping at the first breakpoint, click the green play icon to resume debugging.
Note: While debugging your script, there are several shortcuts to examine your code, its variables, and enable debugging features. Find out how:
Click on the button to enable inline debugging 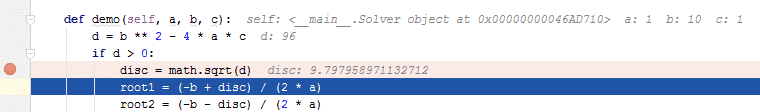
Click on the button to view the parsed file, parse.py to view the backend of your code in detail. 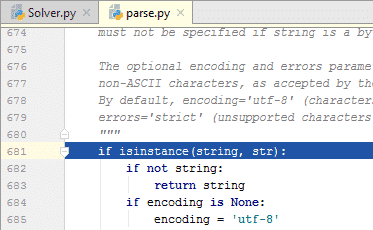
When you keep pressing the same button, your application will move into the next loop until the code ends. 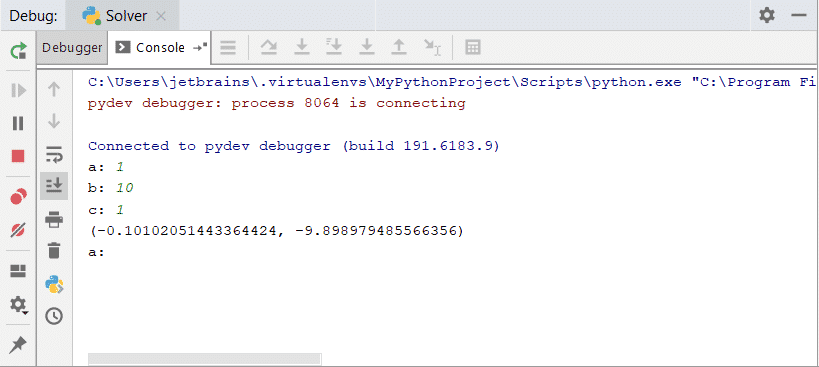
Watching your Variables in PyCharm
To have a deeper understanding of your code, PyCharm allows you to watch variables too. Click on the button on top of the toolbar of the Variables tab. Next, types the name of the variable you want to keep watching throughout the execution of the code.
It will be something like this:
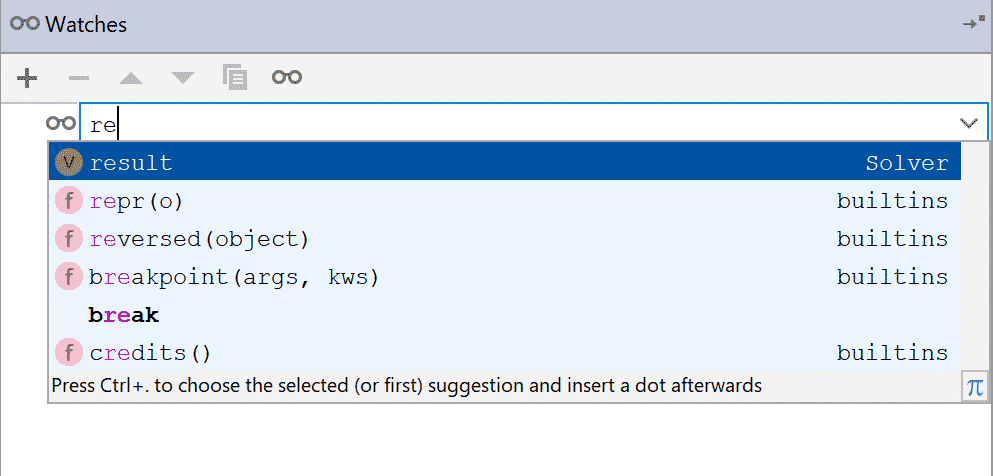
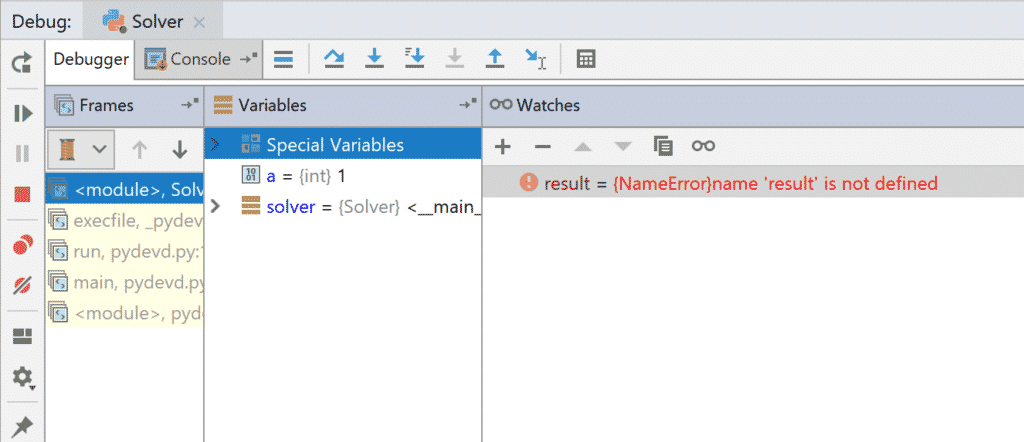
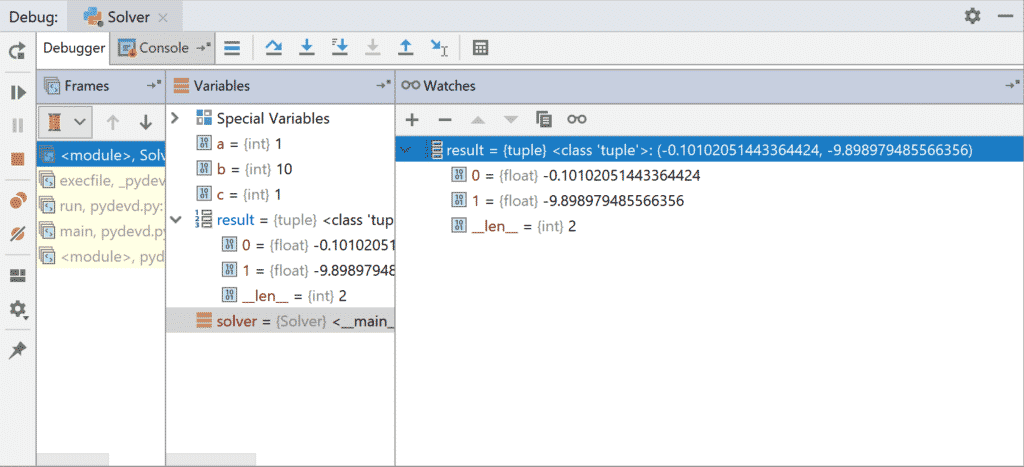
When the debugging session begins, your watch will show an error because the variable has not been defined yet. Once, your debugger reaches the line where you have defined the variable; the watch gets past the error.
Find out how in the images below:
Evaluating Expressions
To find out values or result of a particular expression at any point in the code, click the button. Now, click Evaluate:
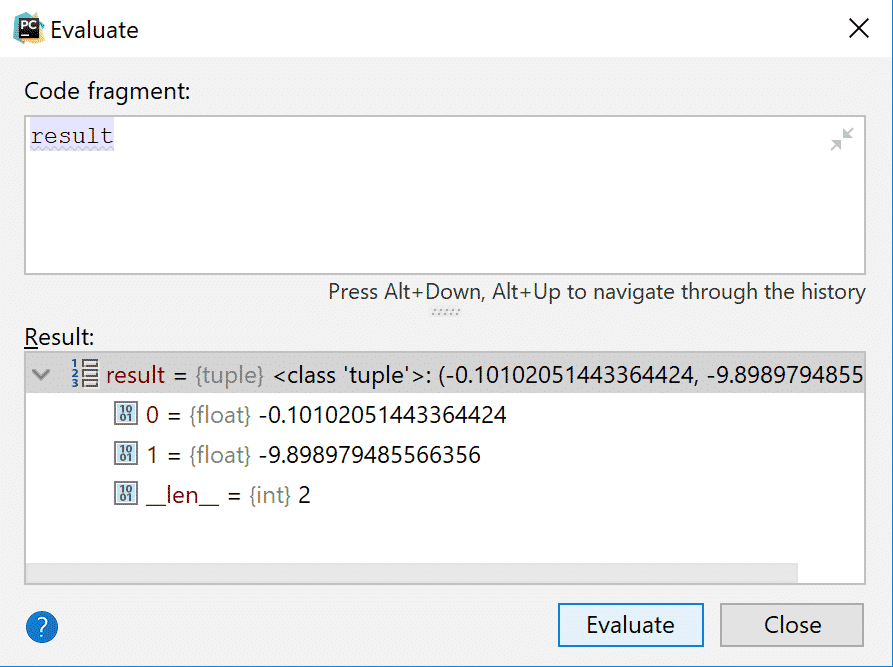
The best part about Evaluate is that it not only lets you watch the expressions but also change variable values too. Check that out in the image below.
Debugging Remote Processes in PyCharm
Whether it’s a code you are working on or some order process in the background, PyCharm lets you debug remote processes too:
To do that:
Open Run and select ‘Attach to Local Process’ 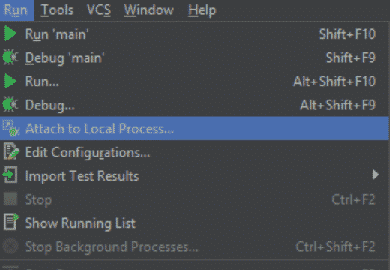 Choose the process you want to debug. It could be any code that you want to attach.
When you select the process, the debugger will start to debug the script. 
Conclusion
Debugging can be a challenge sometimes, but not if you use the right tools and practices! PyCharm’s Debugger tools is a great option for beginners and people who are new to Python. We hope the tutorial helps you attain a better hand at programming and debugging scripts.