Step by Step Installation of RStudio
Rstudio is an integrated set of tools that can help for statistical computing and graphics. RStudio is available as a desktop application and a server application. Also RStudio desktop is available for windows, macOS, and Linux.
In this tutorial, we will be installing RStudio on Ubuntu Linux, specifically Ubuntu 16.04 LTS
To begin the installation:
- To Install RStudio, you need to download and install R for Linux. R for Linux can be found in the software center or via the web. If the software center is not up to date, it may be difficult to locate R for Linux. Via the web, R for Linux can be downloaded from https://cran.studio.com and also via the Linux terminal. To download R, via the web, open a web browser and type https://cran.studio.com from within your Ubuntu
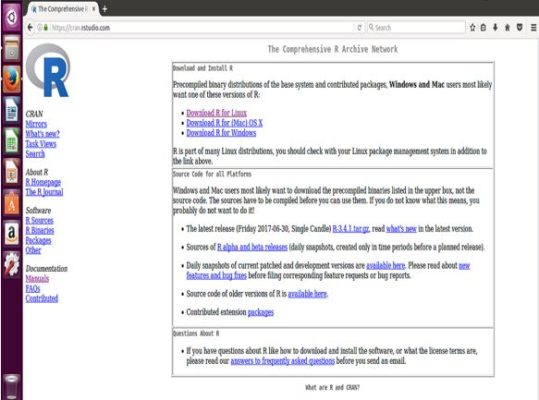
To download via terminal, open a terminal and run the following command:
- Sudo echo “deb http://cran.rstudio.com/bin/linux/ubuntu xenial/” | sudo tee –a /etc/apt/sources.list
The terminal will request for the root password, enter the Ubuntu root password
- Next, add R to Ubuntu keyring by typing:
gpg –keyserver keyserver.ubuntu.com –recv-key E084ADA. This will request a key from the Ubuntu key server
Then add: gpg –a –export E084DAB9 | sudo apt-key add –
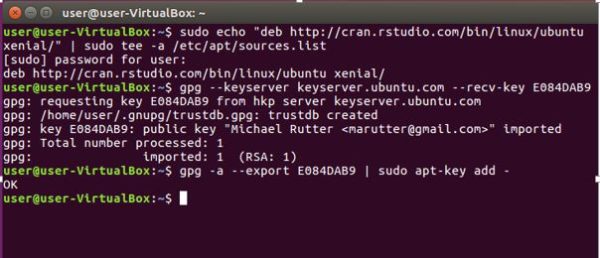
- Next, I will get an update and install R by typing this commands into the terminal
Sudo apt-get update
Sudo apt-get install r-base r-base-dev
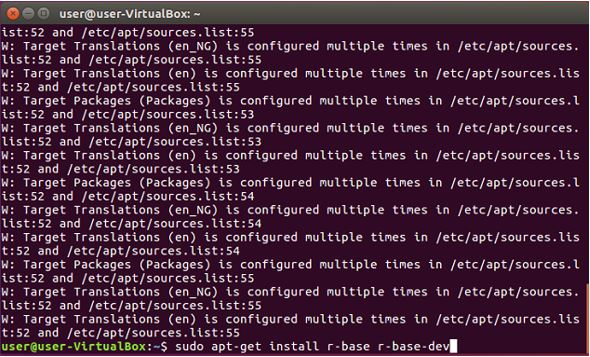
The first command gets the updates and files from a central server on Ubuntu, reads the package list. The second command reads the package and informs the user the amount of space to be used up, finally asks the user if they want to continue with the installation by requesting for a Yes (Y) or No (N).
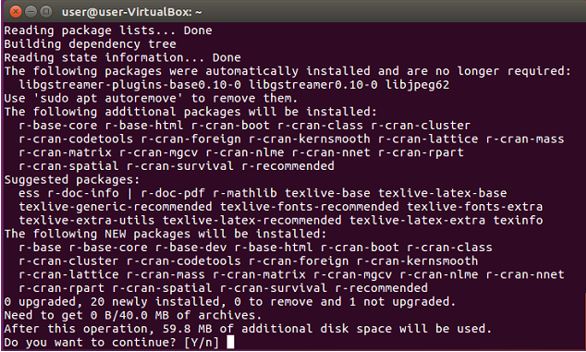
If the user proceeds, the package is unpacked, and the installation will begin.
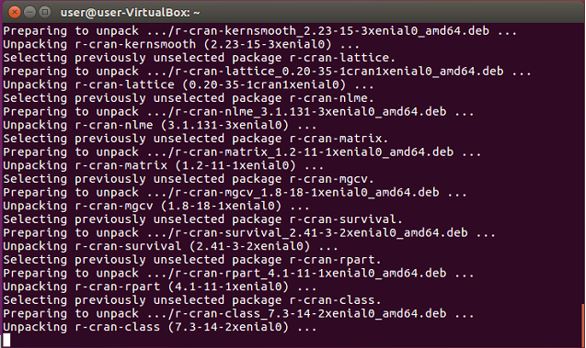
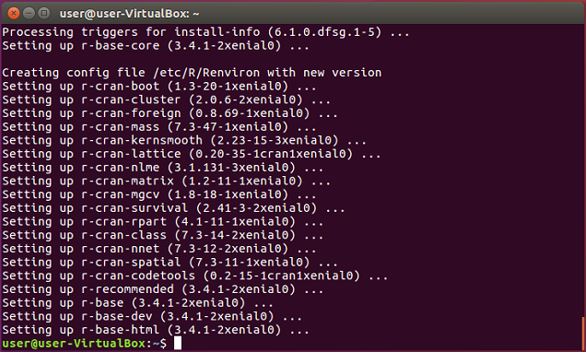
A successful installation is confirmed on the terminal
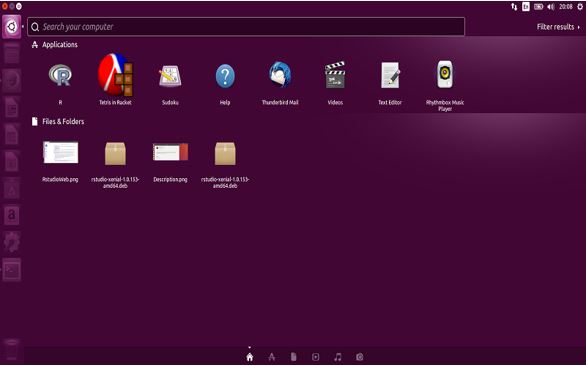
This is further confirmed when searched for in the search box on the desktop
- Next, we install R-Studio via the terminal. Open the terminal and type these commands
sudo apt-get install gdebi-core
The root password will be requested. Enter the root password to proceed. The package will be read and installed
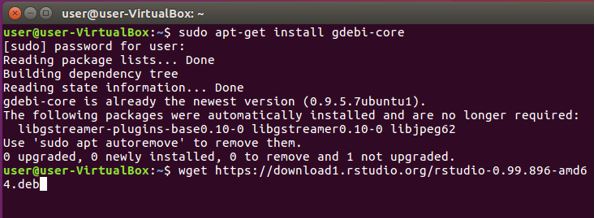
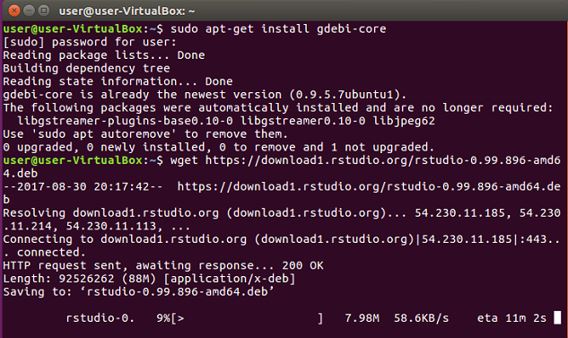
wget https://download1.rstudio.org/rstudio-0.99.896-amd64.deb
This connects to rstudio online package which is now downloaded to the system locally.
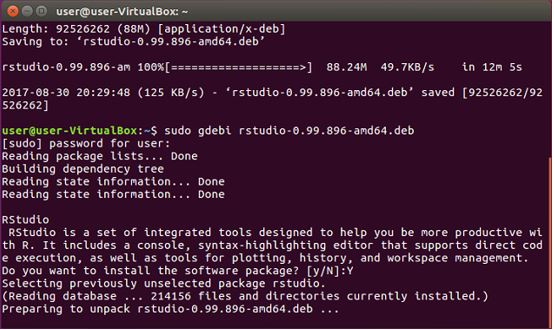
sudo gdebi –n rstudio-0.99.896-amd64.deb
This will request for the root password. Enter the root password to continue. The package will be read and loaded. After loading the terminal will request for permission to install. Click Y to install RStudio
- A successful installation is shown in the terminal
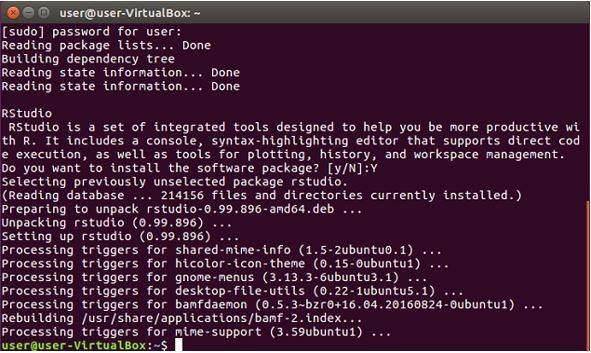
- To run or open RStudio, open the search box and type “R”, RStudio is listed in the list of installed application. Click on it and RStudio will open
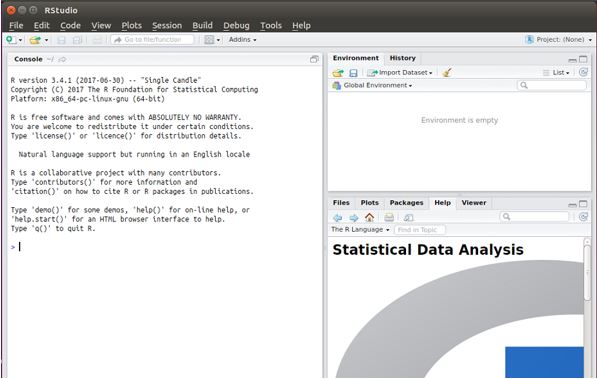
Tutorial of how to use RStudio:
1. Basic Data Analysis using RStudio
RStudio can be used to make some visual representation of the data. You need to follow below steps to use the features of RStudio for basic data analysis:
- Downloading or importing data in R
- Transforming Data and Running queries on data
- Basic data analysis using statistical averages function
- Plotting data distribution
In the tutorial, we have explained individual steps by performing one step at a time.
1.1 Importing Data in RStudio
In this tutorial, we have used the sample 2010 census population data by zip code. There are two different ways to import the data in R.
(a) Following command is used to import the data programmatically by executing it in the console window of RStudio
cpd <- read.csv(url(“https://data.lacity.org/api/views/nxs9-385f/rows.csv?accessType=DOWNLOAD”))
Once you run this command by Enter key, the dataset will be downloaded from the web, read as a csv file and attributed to the variable name cpd.
(b) You can also download the data set first to your local desktop or laptop and then use the import data set feature of RStudio to import the data set into RStudio. Below are the steps to import dataset.
- Go to the environment tab in the top-right section and click on the import dataset Then choose the file you need to import and then click open. Once you click, the Import Dataset dialog will appear.
- Here, you need to set the preferences of decimal, name, separator and other parameters. Then click on import button. This will import the dataset in RStudio and attributed to the variable name as determined before.
You can also view any data set by giving the following command:
View(cpd)
where cpd is the variable data set.
1.2 Transforming Data and Running queries on data
After importing the data in RStudio, you will be able to use various transformation features of R in order to manipulate the data. Below are the examples of basic data access techniques.
- To access a particular column, Ex. Total Population in our case.
cpd$Total Population
- To access data as a vector
cpd[1,3]
You can use the subset function of R in order to run some queries on data. Suppose, if you want those rows from the whole dataset in which the Total Males is greater than Total Females. You will need to run the following command in the console box.
a <- subset(cpd , Total Males > Total Females)
The first parameter to the subset function must be the data frame you want to apply that specified function to and the second parameter is the boolean condition that requires being checked for each row whether to be included or not. So, the above statement will result in the set the rows in which the Total Males is greater than Total Females and put those rows to a
1.3 Basic data analysis using statistical averages function
For calculating the averages of the dataset, following functions can be used:
- Mean of any column, run : mean(cpd$Total Males)
- Median of any column, run : median(cpd$Total Females)
- Quantile of any column, run : quantile(cpd$Total Population)
- Variance of any column, run : var(cpd$Total males)
- Standard Deviation of any column, run : sd(cpd$Total Females)
The statistical summary of the dataset can also be obtained by just running on either a column or the complete dataset as below.
summary(cpd)
1.4 Plotting data distribution
The built in data visualizer for R feature of RStudio is very much liked. The dataset which is imported in the RStudio can be visualized utilizing the plot and various other functions of R.
Below is the example to create a graph:
You can run the following command in console to create a scatter plot of a data set,
plot(x = s$Total Males, y = s$Total Females, type = ‘p’)
Here, ‘s’ is the subset of the original dataset and type ‘p’ is used to set the plot type as a point. You can also select line and other change type variable to ‘L’ etc.
There are several features, packages, and tools available in R for data distribution plots that you can utilize to draw any kind of data distribution. For example;
- You can run the below command to draw a Histogram of a data set,
hist(cpd$Total Households)
- Similarly, run the following set of commands for Bar Plots
counts <- table(cpd$Total Population)
barplot(counts, main=”Total Population Distribution”, xlab=”Number of Total
Population”)
This whole tutorial will give you a basic idea regarding how to do simple statistics in R/RStudio.
- zoo package in the RStudio
If your data is an irregular time series, then zoo package should be utilized for such data. This is because one requires only ordered observations for the time index. zoo package is available in the packages component which appears in the lower-right panel in RStudio. We first need to load the zoo package to convert our data into zoo objects. We call its same-named constructor to create a zoo object. Here, we have to provide the first argument which is the data and the second is for the value to order by. We then combine the data into one zoo object.
zoo object is recommended for its convenient plot method. In this case, we just type plot, and the function completion displays us the various plot methods usable with zoo package.
Note:
- For usage or any documentation of the function in RStudio;
Just type the name of the function and then press ctrl+space to receive the auto completion window.
- To view the official documentation, you can use “?”before any function name.
- Data cleaning can also be performed in RStudio.
Advanced features of RStudio
There are some more add-on packages available with RStudio. The Packages component in the RStudio allows you to choose packages to load or unload and it also provides links to their documentation. Below is the list of some add-on packages available in the packages section in RStudio.
- WMCapacity: It can be used for GUI implementing Bayesian working memory models.
- xlsx: It is used to Read, write, format Excel 2007 and Excel 97/200/Xp/2003 files.
- Xlsxjars: This can be used for package required jars for the xlsx
- XML: It provides tools for parsing and generating XML within R and S-Plus.
- xtable: It is used for exporting tables to LaTeX or HTML.
Next Steps
Follow the R Programming tutorial to go from total beginner to machine learning in just minutes: R Programming Tutorial


