Before Installation:
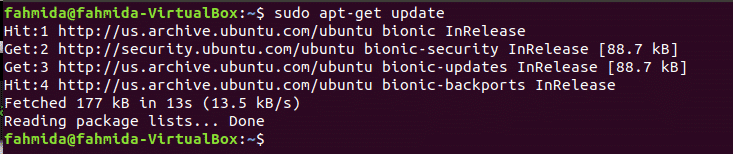
The operating system needs to be updated before installing python(x.y). Run the following command to update the system.
It is necessary to check that any python interpreter is installed before in the system or not. Run the following command to check the installed version of python. It is better to remove any previously installed python version before installing python(x,y).
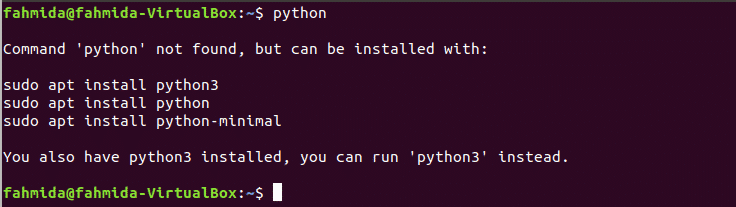
The output shows that no python package has been installed before in the system. For this case, we have to install the python interpreter first.
Install Python(x.y)
You can install python(x,y) or scientific python packages in two ways. One way is to download and install an appropriate python(x,y) package based on Ubuntu and another way is to install necessary packages for performing scientific computing in Python. The second way is easy to install which is followed in this tutorial.
Steps:
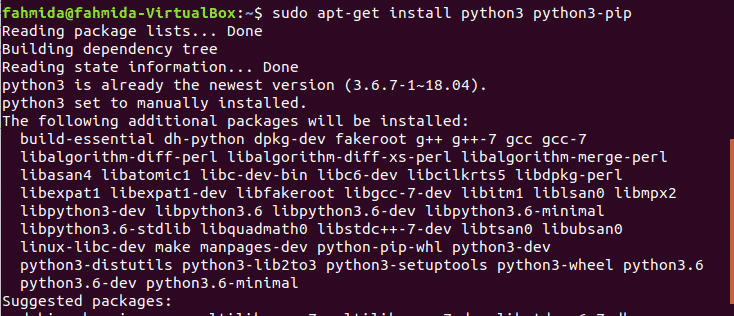
- First, you have to install the python interpreter and package manager to start the installation process. So, run the following command to install python3 and python3-pip packages. Press ‘y’ when it will ask permission for installation.
- Next, you have to install the necessary scientific libraries of python3 for doing scientific operations. Run the following command to install the libraries. Here, five libraries will be installed after executing the command. These are numpy, matplotlib, scipy, pandas and sympy. The uses of these libraries are explained in the next part of this tutorial.
python3-scipy python3-pandas python3-sympy

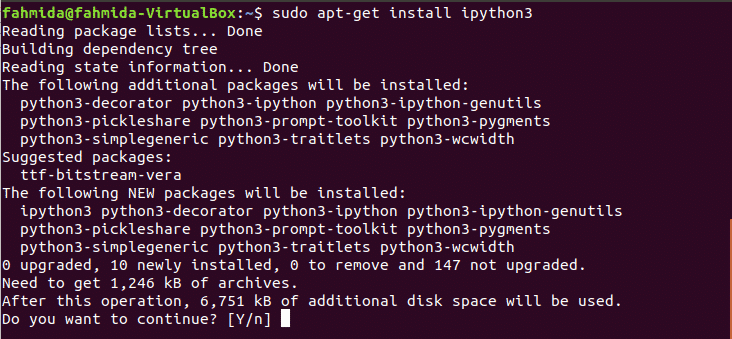
- To remove the limitations of the python interpreter and provide a user-friendly interface, ipython package is used. Run the following command to install ipython3 package.
- Run the following command to install qt5 related packages for GUI development.
python3-pyqt5.qtopengl python3-pyqt5.qtquick

- Spyder is a useful code editor that can highlight the syntax, and make the code editing and debugging easier. Run the following command to install spyder.

If all the packages mentioned above are installed properly without any error then your python(x,y) is installed properly.
Using Python(x,y):
Some basic uses of python(x,y) are shown in this part of the tutorial by using different examples with explanations. You will need to run the spyder code editor to start using python(x,y). Click on the Show Application icon and type ‘sp’ in the search box. If spyder is installed properly then spyder icon will appear.

Click on Spyder3 icon to open the application. The following screen will appear after opening the application.
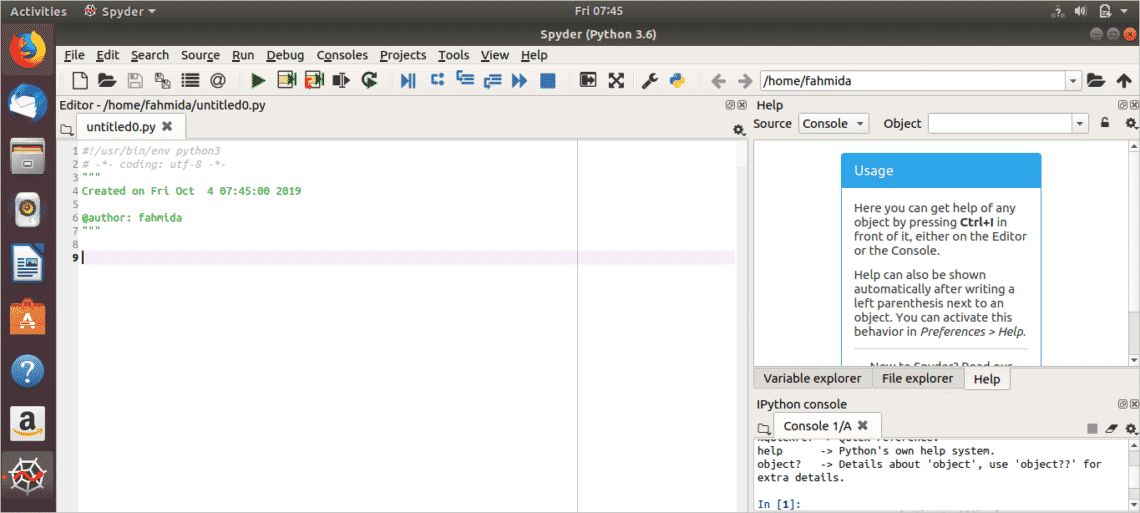
Now, you can start writing code for doing scientific computing tasks. The basic uses of the five installed libraries of python3 for scientific operations are shown in the following six examples.
Example-1: Using variables and types
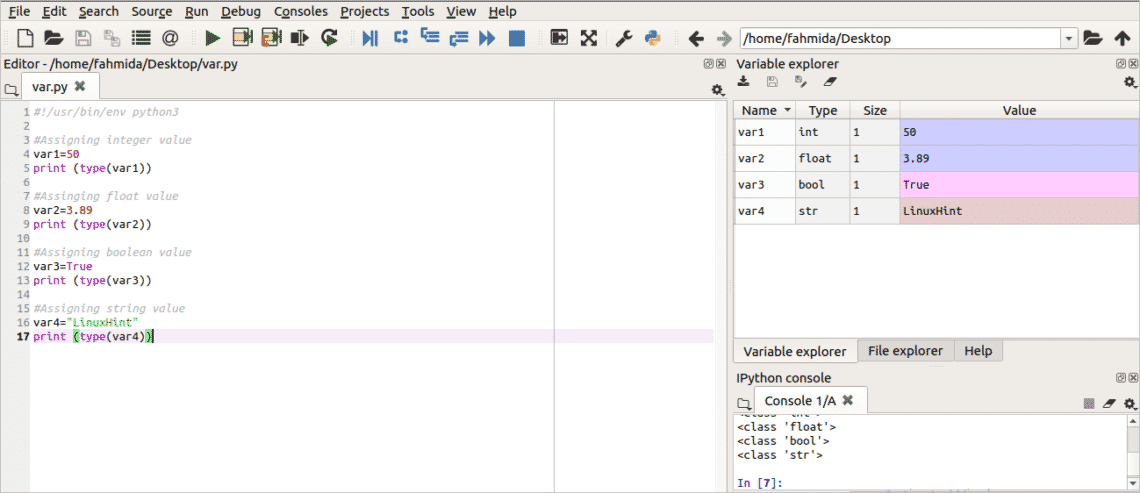
This example shows the very basic use of python data types and variables. In the following script, four types of variables are declared. These are integer, float, boolean and string. type() method is used in python to find out the type of any variable.
#Assigning integer value
var1 = 50
print (type(var1))
#Assinging float value
var2 = 3.89
print (type (var2))
#Assigning
var3 = True
print (type(var3))
#Assigning string value
var4 = "LinuxHint"
print (type(var4))
Output:
Run the script by pressing play ( ) button from the top of the editor. If you click on the Variable explorer tab from the right side then the following output will appear for the four variables.
Example-2: Using numpy to create one and multi-dimensional array
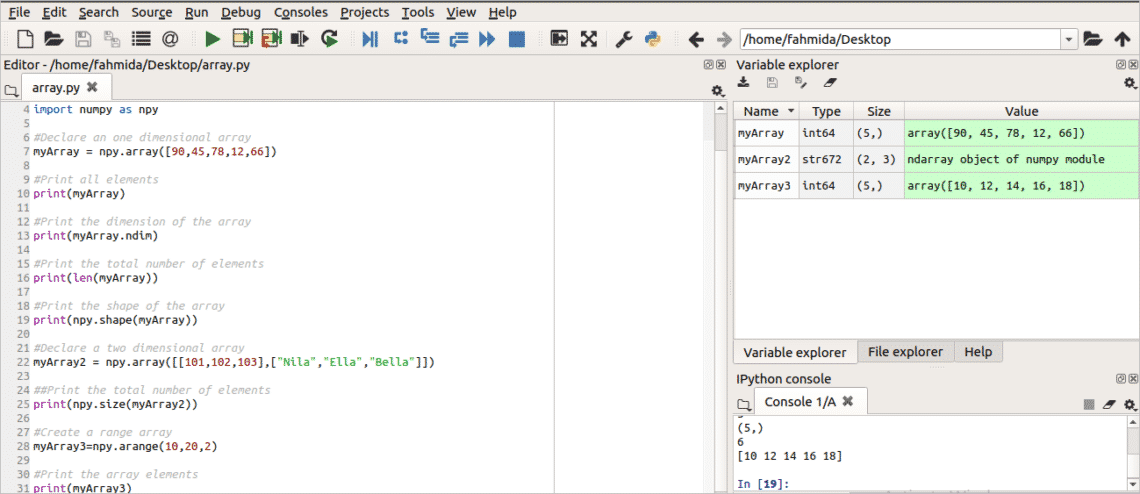
All types of numerical computing are done by numpy package in python. The multi-dimensional data structure, vector, and matrix data can be defined and used by this module. It can calculate very quickly because it is developed by C and FORTRAN. numpy module is used in the following script to declare and use one-dimensional and two-dimensional arrays in python. Three types of arrays are declared in the script. myArray is a one-dimensional array that contains 5 elements. ndim property is used to find out the dimension of an array variable. len() function is used here to count the total number of elements of myArray. shape() function is used to display the current shape of the array. myArray2 is a two-dimensional array that contains six elements in two rows and three columns(2×3=6). size() function is used to count the total elements of myArray2. arrange() function is used to create a range array named myArray3 that generates elements by adding 2 with each element from 10.
#Using numpy
import numpy as npy
#Declare an one dimensional array
myArray = npy.array([90,45,78,12,66])
#Print all elements
print(myArray)
#Print the dimension of the array
print(myArray.ndim)
#Print the total number of elements
print(len(myArray))
#Print the shape of the array
print(npy.shape(myArray))
#Declare a two dimensional array
myArray2 = npy.array([[101,102,103],["Nila","Ella","Bella"]])
##Print the total number of elements
print(npy.size(myArray2))
#Create a range array
myArray3=npy.arange(10,20,2)
#Print the array elements
print(myArray3)
Output:
The following output will appear after running the script.
Example-3: Using Matlab to draw a curve
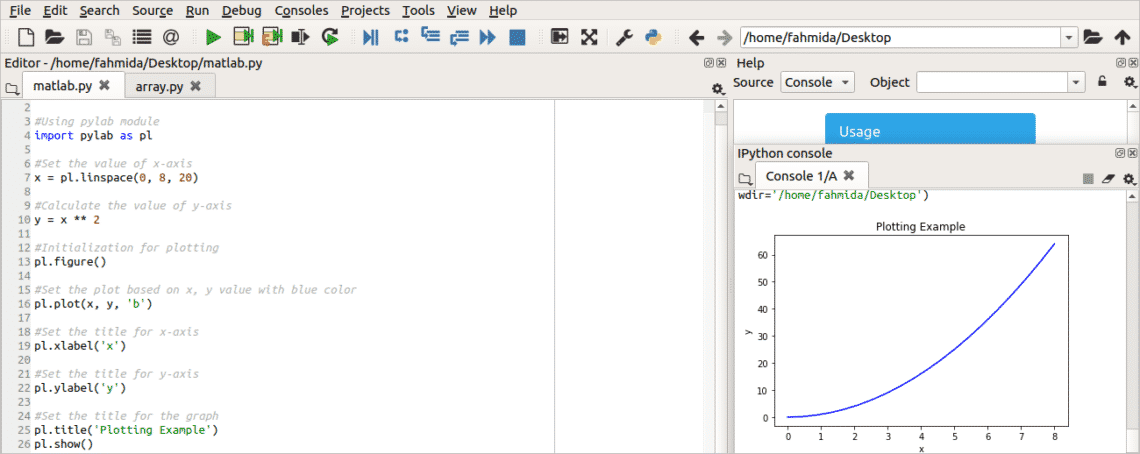
Matplotlib library is used to create 2D and 3D scientific figures based on specific data. It can generate high-quality output in different formats such as PNG, SVG, EPG, etc. It is a very useful module for generating figures for research data where the figure can be updated any time by changing data. How you can draw a curve based on the x-axis and y-axis values using this module is shown in this example. pylab is used to draw the curve here. linspace() function is used to set the x-axis value in regular interval. Y-axis values are calculated by squaring the value of the x-axis. figure() is an init function that is used to enable pylab. ‘b’ character is used in plot() function to set the color of the curve. Here, ‘b’ indicates blue color. xlabel() function is used to set the title of x-axis and ylabel() function is used to set the title of y-axis. The title of the graph is set by title() method.
#Using pylab module
import pylab as pl
#Set the value of x-axis
x = pl.linspace(0, 8, 20)
#Calculate the value of y-axis
y = x ** 2
#Initialization for plotting
pl.figure()
#Set the plot based on x, y value with blue color
pl.plot(x, y, ‘b’)
#Set the title for x-axis
pl.xlabel(‘x’)
#Set the title for y-axis
pl.ylabel(‘y’)
#Set the title for the graph
pl.title(‘Plotting Example’)
pl.show()
Output:
The following output will appear after running the script. The curve is shown in the right bottom side of the image.
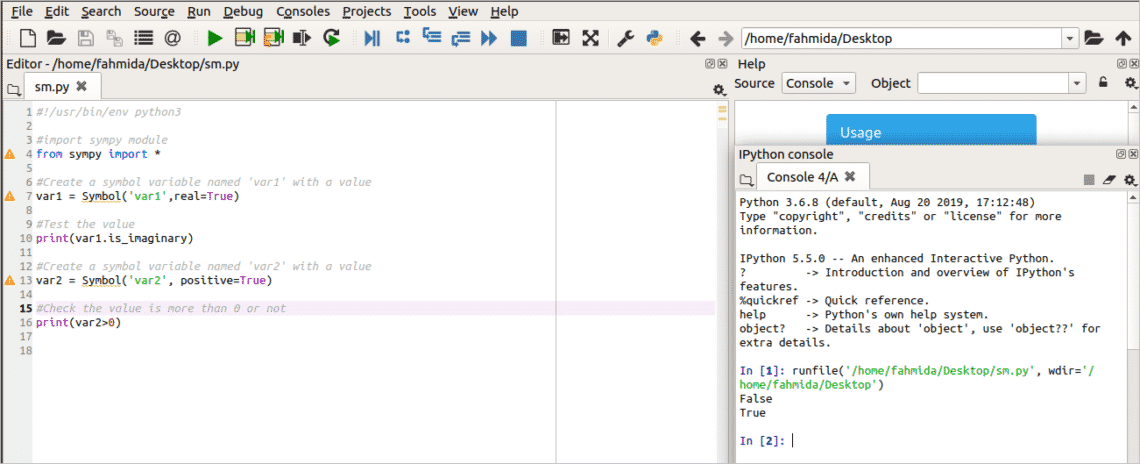
Example-4: Using sympy module for Symbolic variables
sympy library is used in python for symbolic algebra. Symbol class is used to create a new symbol in python. Here, two symbolic variables are declared. var1 variable is set to True and is_imaginary property returns False for this variable. var2 variable is set to true that indicates 1. So, when it is checked that var2 is greater than 0 or not then it returns True.
#import sympy module
from sympy import *
#Create a symbol variable named ‘var1’ with a value
var1 = Symbol(‘var1’,real=True)
#Test the value
print(var1.is_imaginary)
#Create a symbol variable named ‘var2’ with a value
var2 = Symbol(‘var2’, positive=True)
#Check the value is more than 0 or not
print(var2>0)
Output:
The following output will appear after running the script.
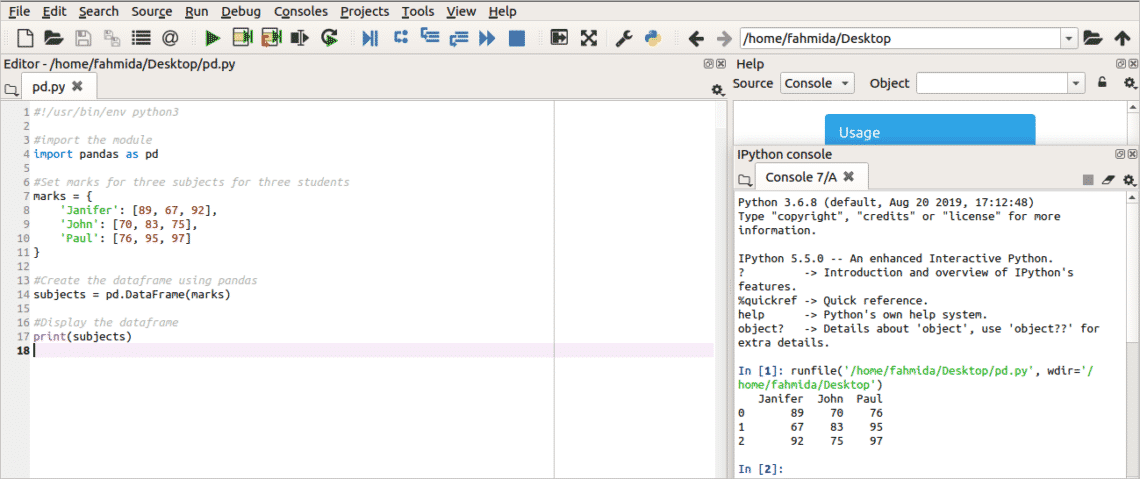
Example-5: Create DataFrame using pandas
pandas library is developed for cleaning, analyzing and transforming any data in python. It uses many features of numpy library. So, it is essential to install numpy library of python before installing and using pandas. It is also used with other scientific libraries of python like scipy, matplotlib etc. The core components of pandas are series and DataFrame. Any series indicates the column of data and a DataFrame is a multi-dimensional table of a collection of series. The following script generates a DataFrame based on three series of data. Pandas library is imported at the beginning of the script. Next, a variable named marks is declared with three series of data that contain marks of three subjects of three students named ‘Janifer’, ‘John’ and ‘Paul’. DataFrame() function of pandas is used in the next statement to generate a DataFrame based on the variable marks and store it in the variable, result. Lastly, the result variable is printed to display the DataFrame.
#import the module
import pandas as pd
#Set marks for three subjects for three students
marks = {
‘Janifer’: [89, 67, 92],
‘John’: [70, 83, 75],
‘Paul’: [76, 95, 97]
}
#Create the dataframe using pandas
subjects = pd.DataFrame(marks)
#Display the dataframe
print(subjects)
Output:
The following output will appear after running the script.
Example-6: Using scipy module for mathematical calculation
SciPy library contains a large number of scientific algorithms for performing scientific computing in python. Some of them are Integration, Interpolation, Fourier transform, Linear algebra, Statistics, File IO, etc. Spyder editor is used to write and execute the codes in previous examples. But spyder editor does not support the scipy modules. You can check the list of supported modules of spyder editor by pressing Dependencies… option of help menu. Scipy module does not exist in the list. So, the following two examples are shown from the terminal. Open the terminal by pressing “Alt_Ctrl+T” and type python to run the python interpreter.
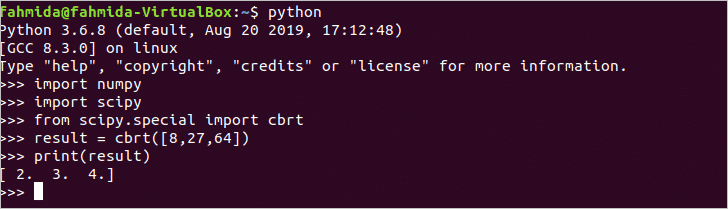
Calculating the cube root of numbers
scipy library contains a module named cbrt to calculate the cube root any number. The following script will calculate the cube root of three numbers. numpy library is imported to define the list of the numbers. Next, scipy library and cbrt module which is under scipy.special are imported. The cube root values of 8, 27 and 64 are stored in the variable result that is printed later.
>>> import scipy
>>> from scipy.special import cbrt
>>> result = cbrt([ 8, 27, 64])
>>> print(result)
Output:
The following output will appear after running the commands. The cube root of 8, 27 and 64 are 2, 3 and 4.
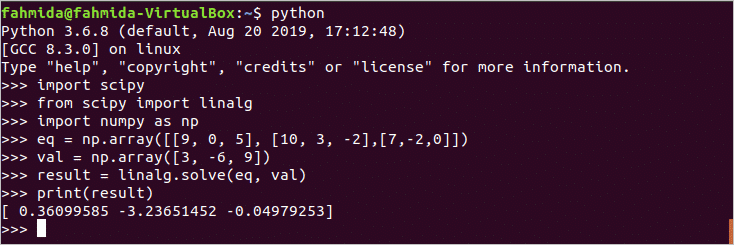
Solving Linear algebra by using scipy module
linalg module of scipy library is used to solve the linear algebra. Here, scipy library is imported in the first command and the next linalg module of scipy library is imported. numpy library is imported to declare the arrays. Here, eq variable is declared to define the coefficients and val variable is used to define the respective values for calculation. solve() function is used to calculate the results based on eq and val variables.
>>> from scipy import linalg
>>> import numpy as np
>>> eq = np.array([[9, 0, 5], [10, 3, –2], [7, –2, 0]])
>>> val = np.array([3, –6, 9])
>>> result = linalg.solve(eq,val)
>>> print(result)
Output:
The following output will appear after running the above commands.
Conclusion:
Python is a very useful programming language for solving different types of mathematical and scientific problems. Python contains huge numbers of libraries for doing this type of task. The very basic uses of some libraries are shown in this tutorial. If you want to be a scientific programmer and novice for python(x,y) then this tutorial will help you to install and use python(x,y) on Ubuntu.
A demo can be found here below: