Disk Usage Information:
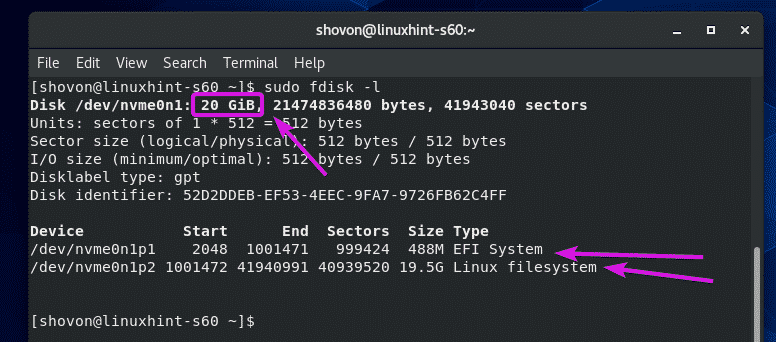
You can find information about the partitions of your HDDs, SSDs, and other storage devices using the fdisk command.
As you can see, I have 1 NVME SSD connected to my virtual machine. It’s about 20 GB in size.
It has 2 partitions, /dev/nvme0n1p1 (488MB in size) and /dev/nvme0n1p2 (19.5 GB in size).
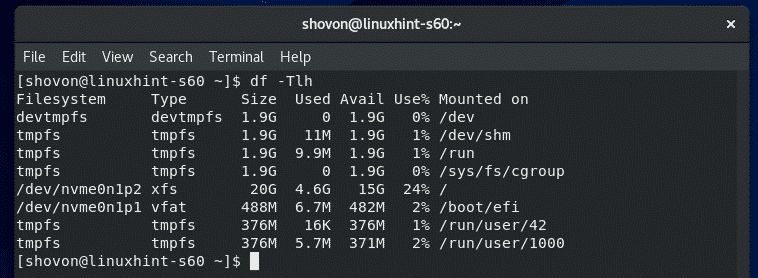
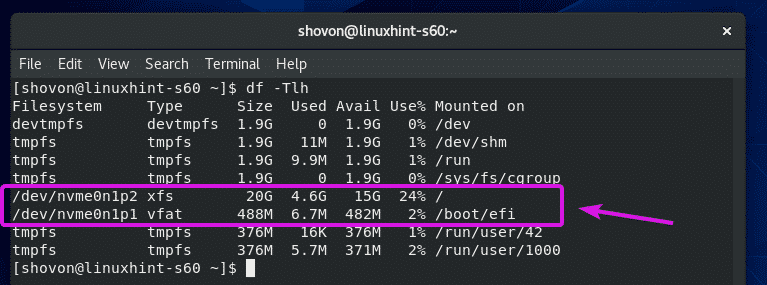
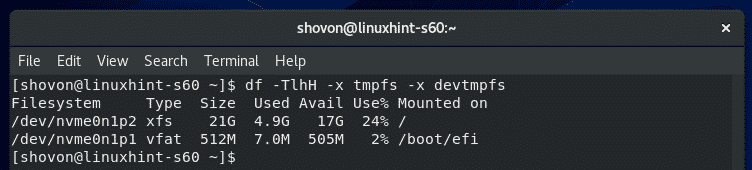
You can find information about the mounted partitions using the df command.
The df command should show the partition path, partition’s filesystem type, total partition size, how much of the partition is used and free, the disk usage in percentage, and where the partition is mounted.
By default, tmpfs, devtmpfs and other virtual filesystems are shown. You may want to only see information on actual filesystems/partitions.
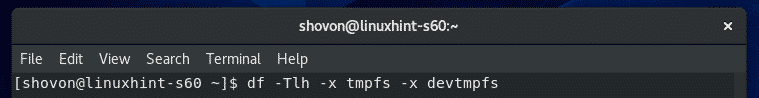
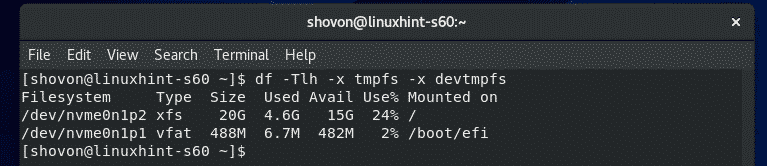
If that’s the case, you can use -x option to exclude the filesystems that you don’t want to be listed.
Only the physical partitions/filesystems should be listed.
By default, the partition size is displayed in powers of 1024. If you want to see it in powers of 1000 instead, then use the H option as follows:
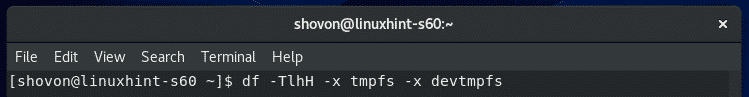
The partition size should now be displayed in powers of 1000.
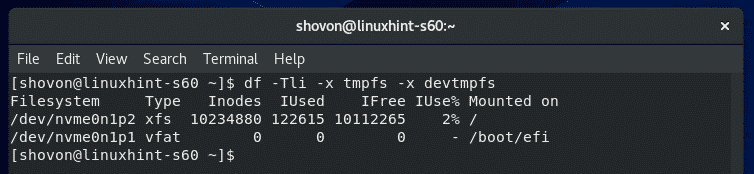
If you want to see how many inodes the filesystem has, how many are used and how many are free, use the -i option as follows:
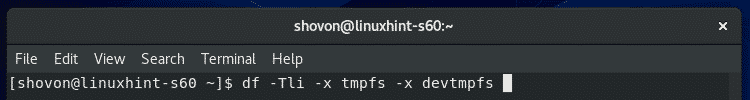
df should show inode information.
Monitoring Disk I/O:
You can monitor disk I/O usage using iotop.
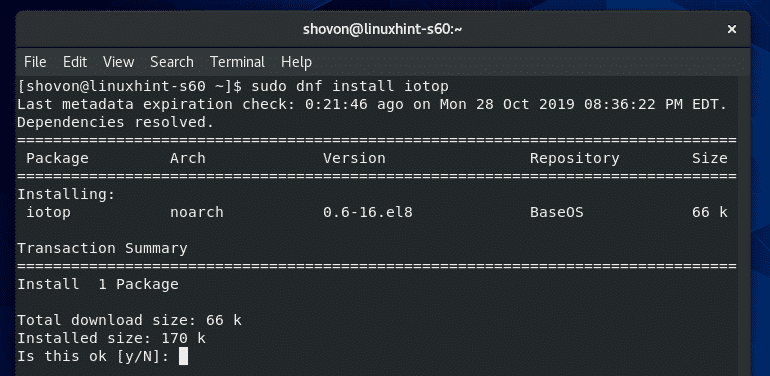
iotop is not installed on CentOS 8 by default. You can easily install iotop with the following command:
Press Y and then press <Enter> to confirm the installation.
iotop should be installed.
Now, start iotop as follows:
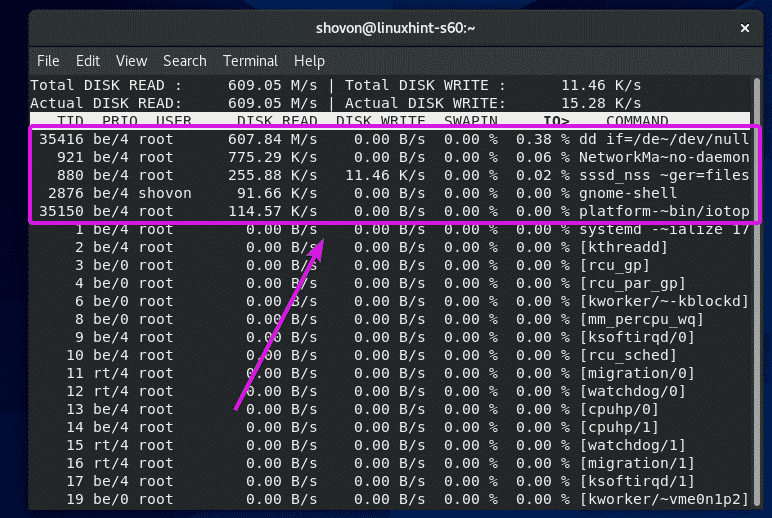
iotop should start. It is just like htop.
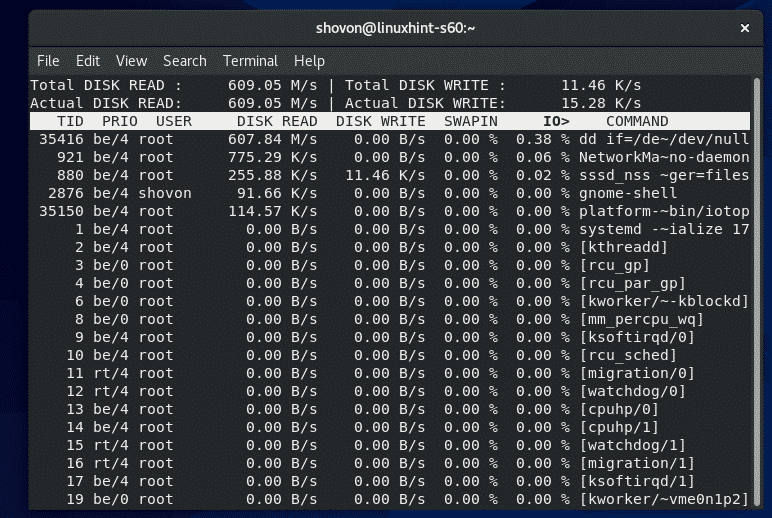
As you can see, the processes/threads that are using disk I/O are on the top. It shows how much data is being written to the disk and read from the disk.
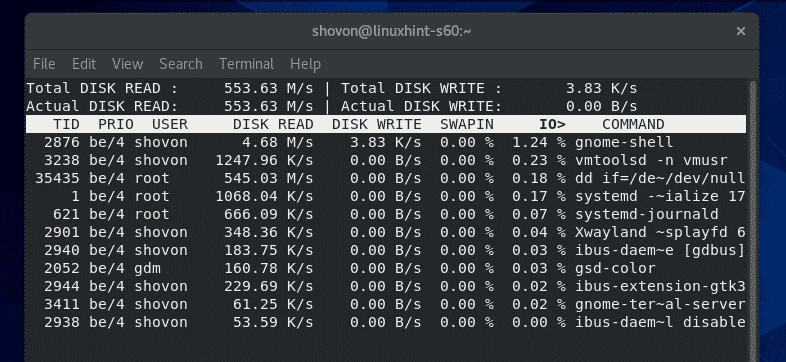
By default, all the processes/threads are displayed. If you want iotop to list only the processes/threads that are performing I/O operations, then press O.
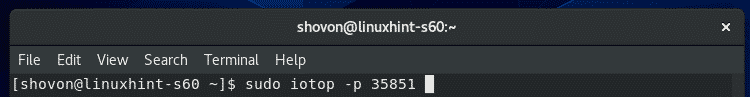
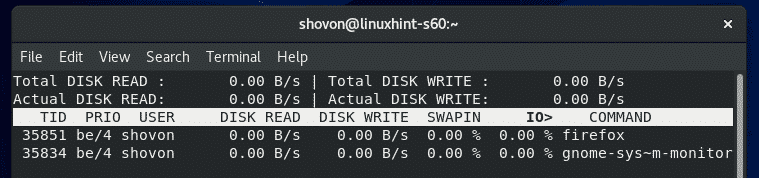
You can also tell iotop to monitor disk I/O of any specific process using the -p option followed by the process PID.
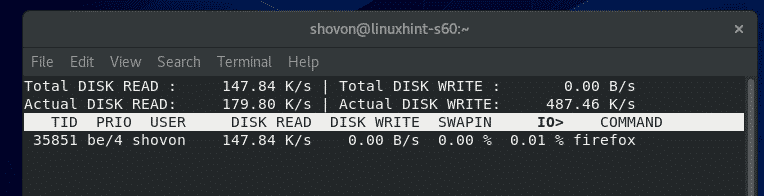
iotop should monitor the disk I/O of only that specified process.
You can also tell iotop to monitor disk I/O of multiple processes as follows:
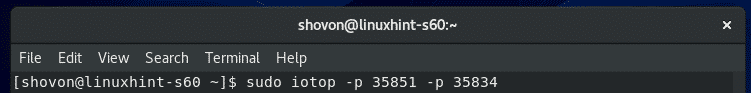
iotop should only monitor disk I/O of the specified processes.
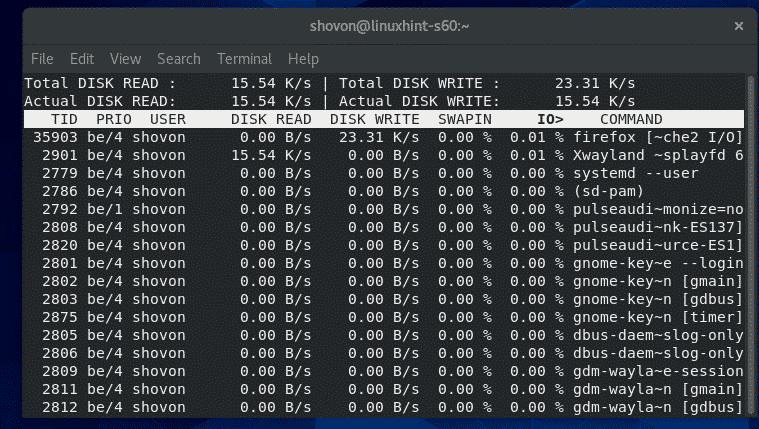
If you want iotop to monitor all processes started by any specific user, use the -u option followed by the username.
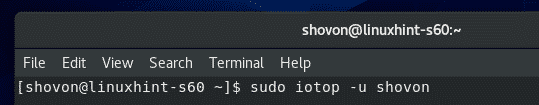
iotop should monitor disk I/O of all processes started by your specified username.
The same way, you can also monitor disk I/O of all the processes started by multiple users as follows:
Monitoring Network Usage:
You can monitor network usage information using the iftop command.
iftop is available in the EPEL repository.
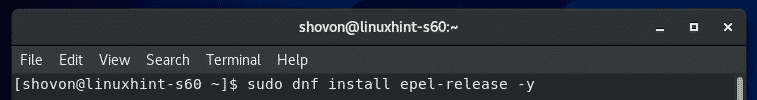
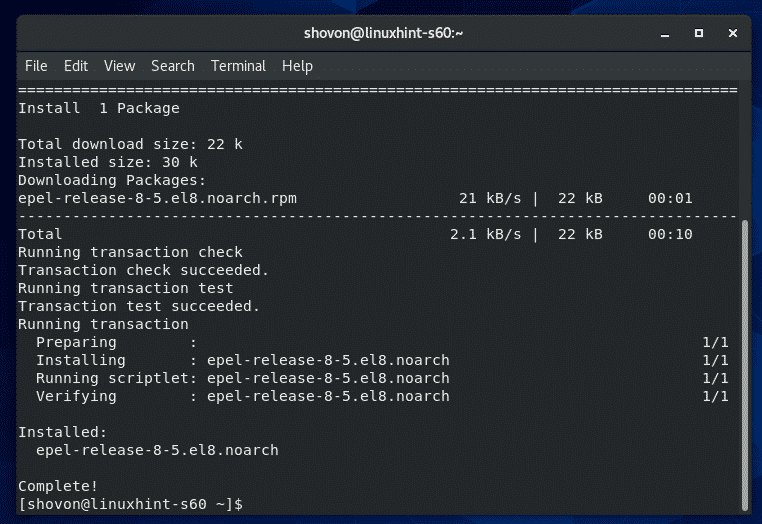
To enable EPEL repository, run the following command:
EPEL repository should be enabled.
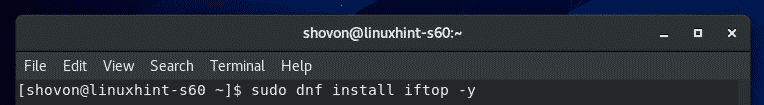
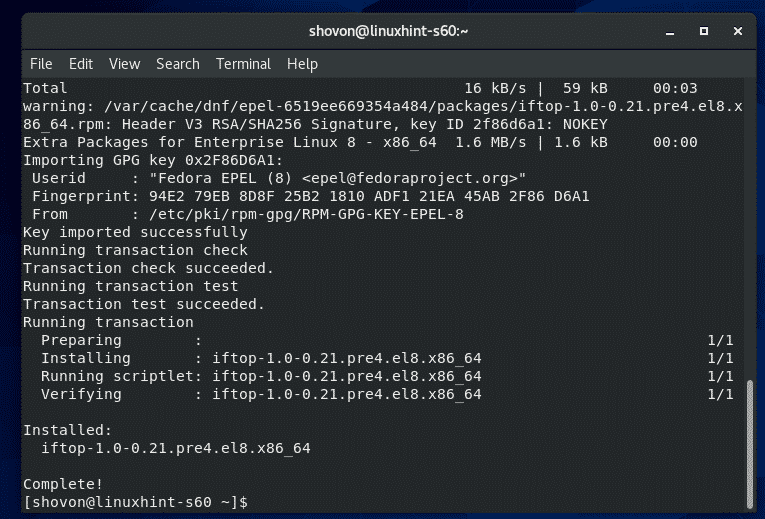
Now, install iftop with the following command:
iftop should be installed.
Now, start iftop as follows:
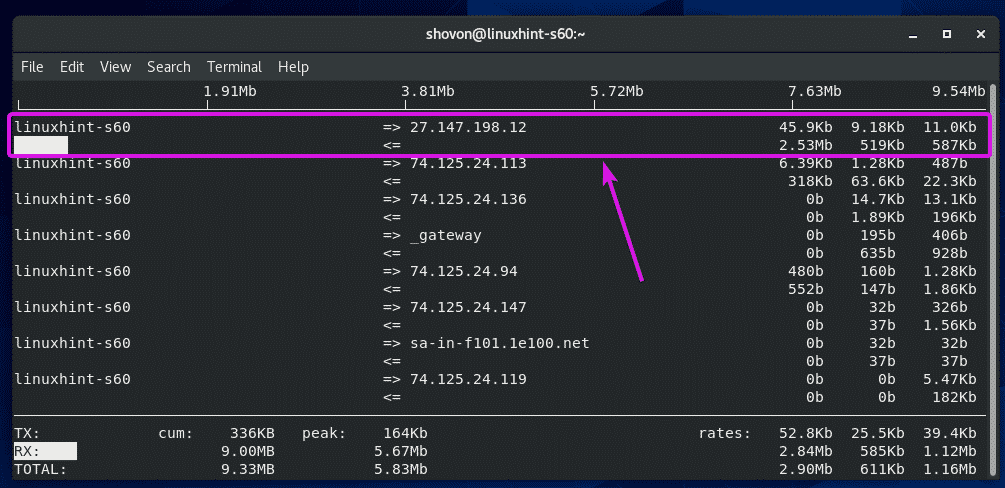
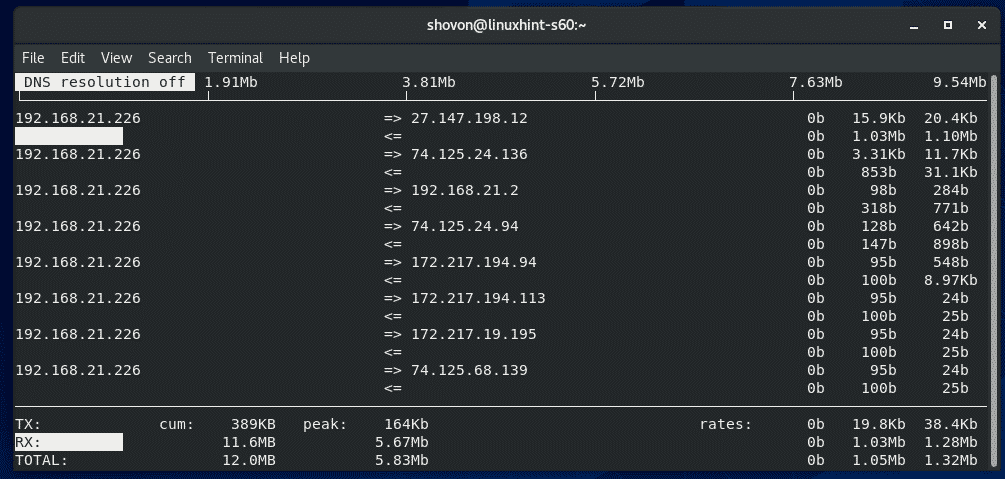
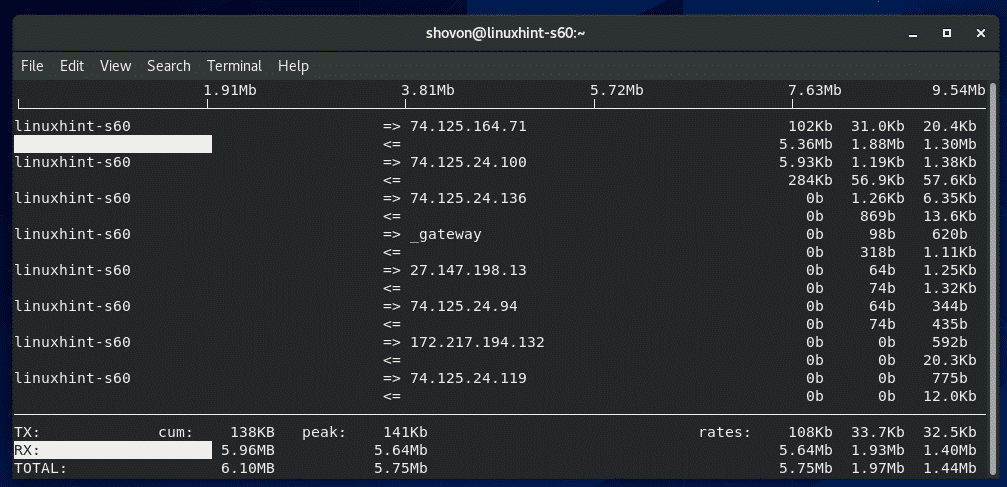
As you can see, iftop monitors the network traffic on destination and source host basis.
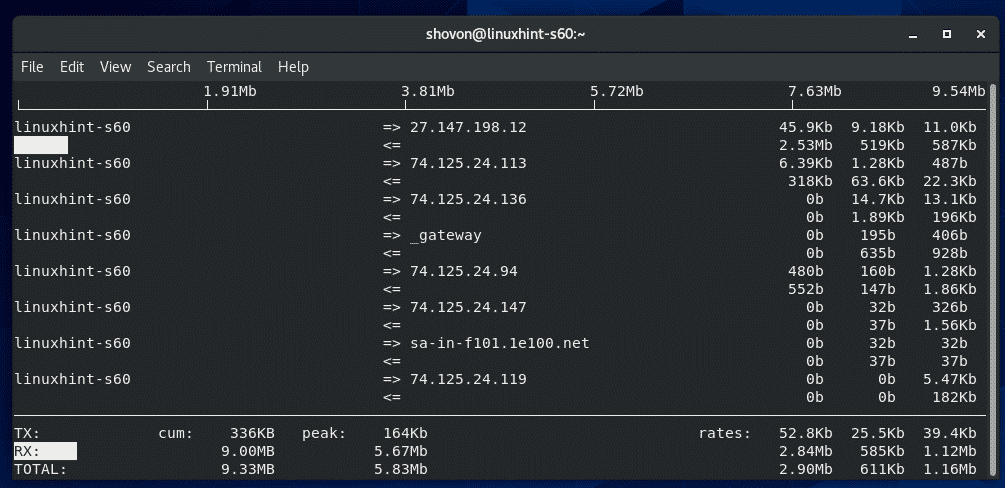
iftop uses => and <= symbols to represent the direction of the data flow. => is used to represent TX/transmitted data and <= is used to represent RX/received data.
On the right side, TX and RX data rate at 2, 10 and 40 seconds intervals are displayed respectively for each host/destination.
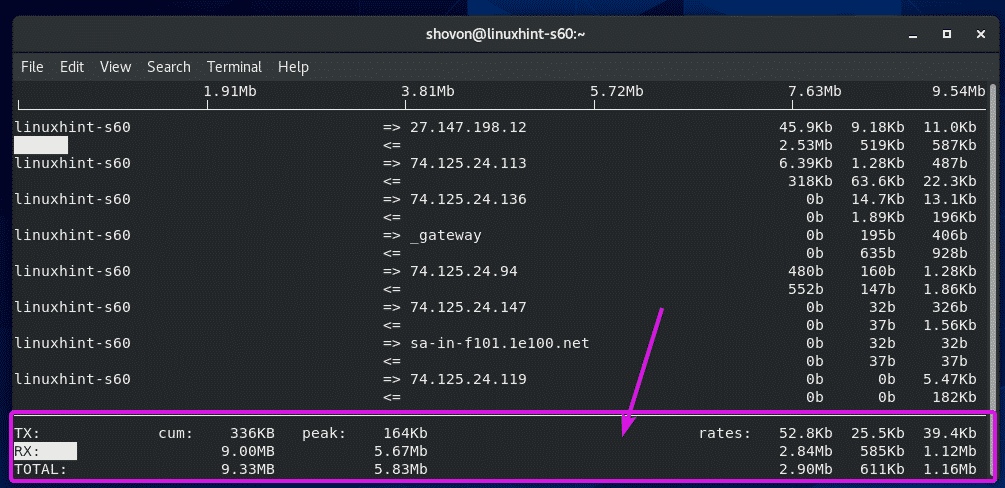
On the bottom, TX section displays the total transmitted data and RX section displays the total received data. The TX and RX totals are summed and is displayed on the TOTAL section.
If you don’t want iftop to resolve IP address to hostname, press N.
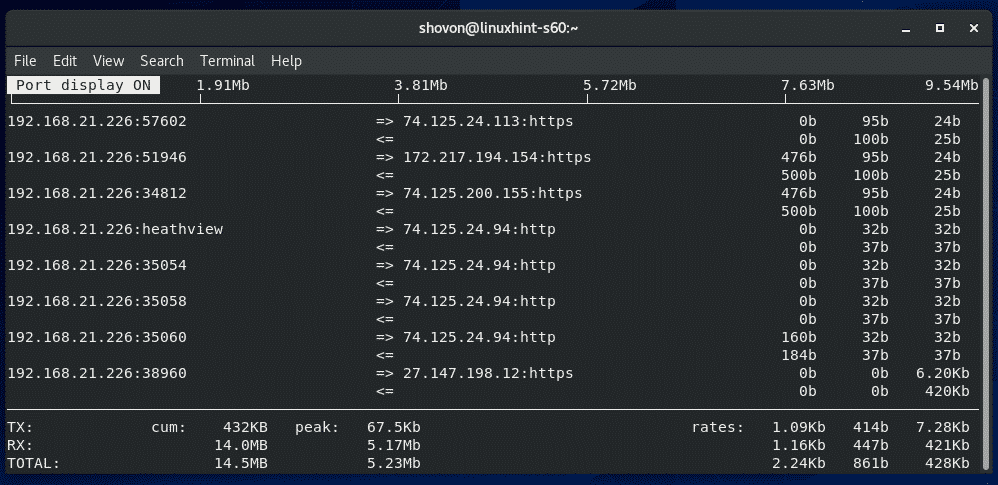
If you want iftop to display the communicating port numbers/protocols as well, press P.
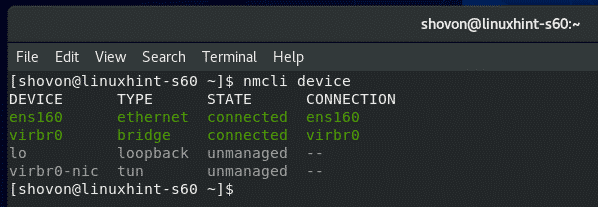
By default, iftop monitors all the available network interfaces of your CentOS 8 machine. If you need to monitor a single network interface, iftop can do that.
First, find the device name of the network interface that you want to monitor using the nmcli command as follows:
Now, let’s say, you want to monitor the network interface ens160. To do that, start iftop as follows:
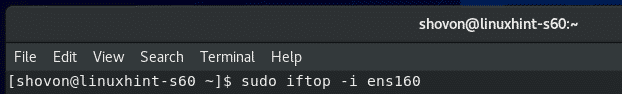
iftop should monitor network traffic of only ens160 interface.
By default, iftop starts an ncurses based interactive window like htop.
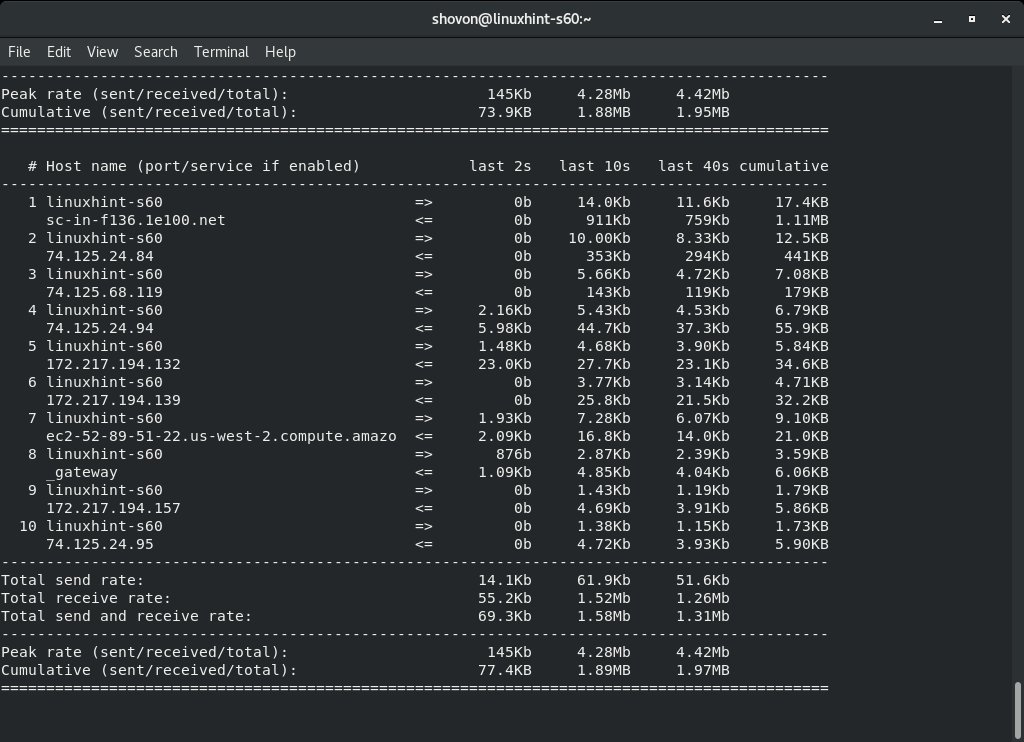
If you want to print the network usage information on the terminal instead, run iftop with the -t flag as follows:
iftop should print everything on the terminal. iftop will print new information on the terminal every 2 seconds.
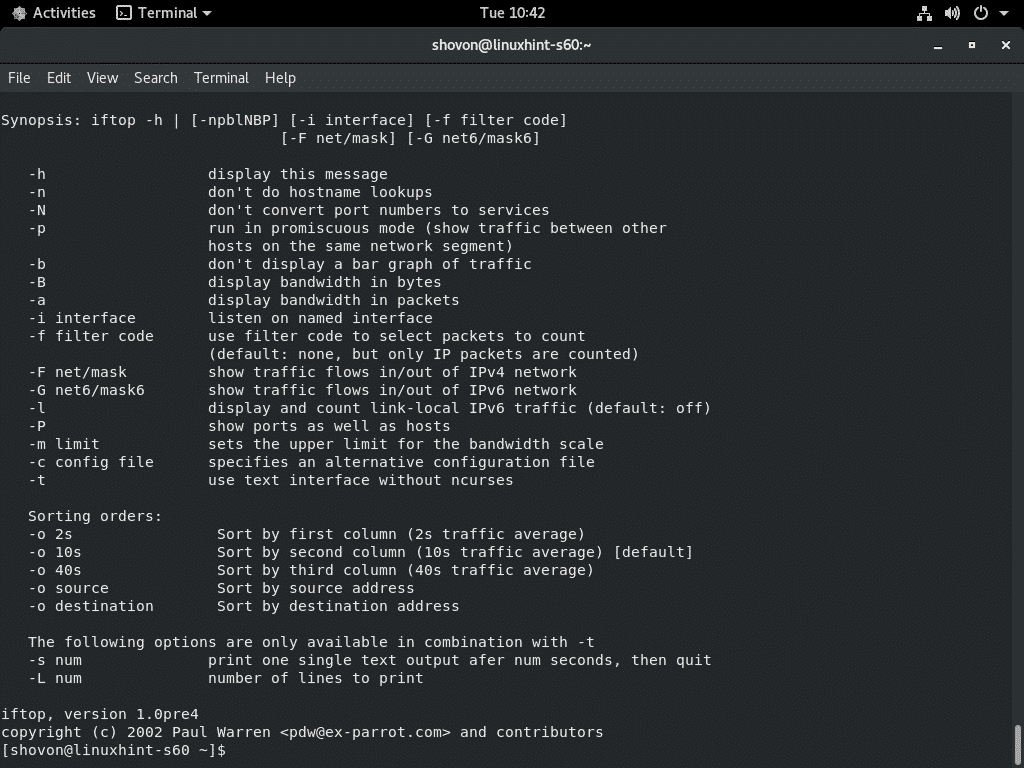
To learn more information on iftop, run iftop with the –help flag as follows:
All the supported flags/options of iftop should be listed. It will be of a great help to you on your Linux sysadmin journey.
So, that’s how you monitor CentOS 8 disk usage, disk I/O and network traffic. Thanks for reading this article.