Charts can be generated by server-side and client-side scripts. There are some advantages and disadvantages of using server-side and client-side charts. The chart generated by server-side scripts increases the server load and makes the site slower, but if you have enough server performance it makes the front end lighter.
Charts can be generated locally by fetching XML or JSON data from server in client-side script. The chart created by client-side scripts not only make the download faster but also various customized charts can be created, such as applying animation in the chart, making the chart attractive etc.
In this tutorial, you will learn to create chart using server-side library and PHP.
Server-Side Charts
Many server-side PHP chart libraries are available in free and commercial versions. pChart, phpGraphLib, Chart4PHP etc. are PHP libraries to create server-side chart in the web page. pChart library still contains many bugs and not suitable for creating chart for web page. phpGraphLib library is used in this tutorial to create server-side chart.
phpGraphLib:
It is a light-weight open source PHP library for creating charts in a web page and it doesn’t require to install and enable any extension for using it like pChart. Different types of charts can be easily created with this library. It has many customization features to create various bar chart, pie chart, stacked chart etc. based on static or dynamic data. To start working with this library go to the following URL to download phpgraphlib library.
https://github.com/elliottb/phpgraphlib
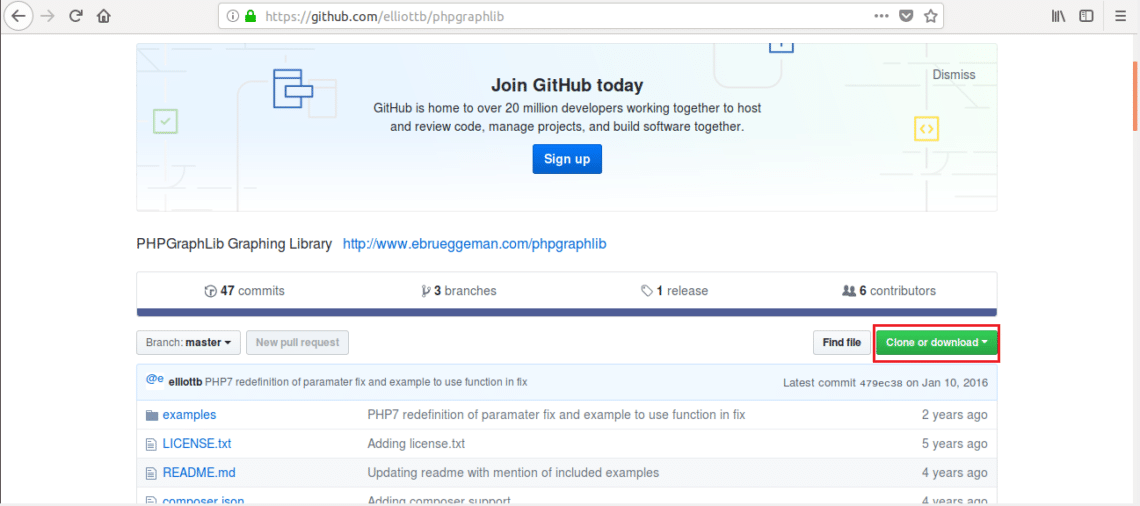
After download, unzip the file and store it on /var/www/html folder to run the files from apache server.
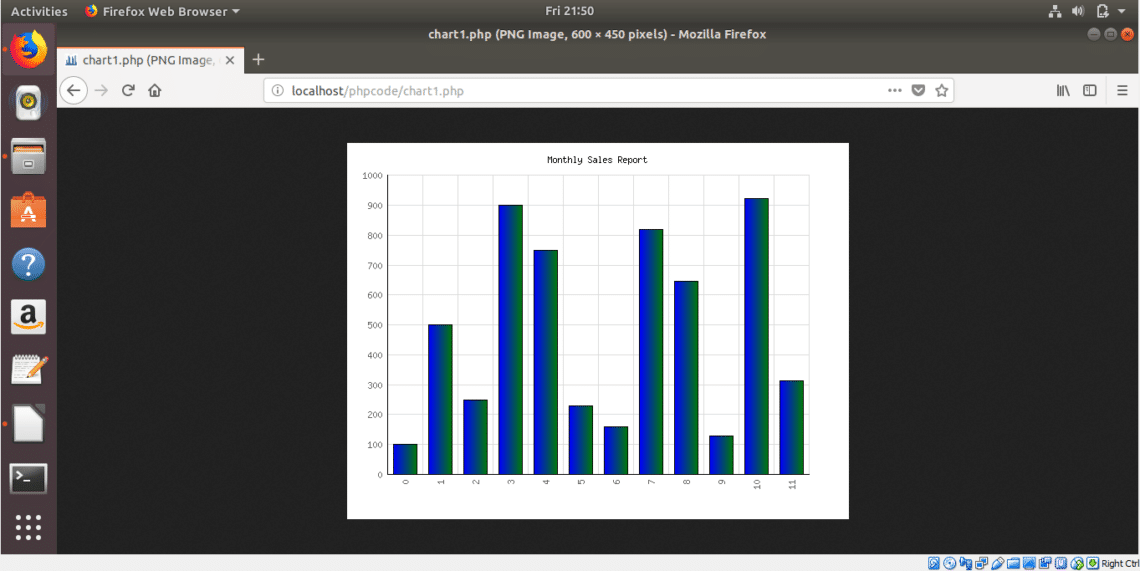
Example-1: Creating 3D bar chart
Write the following script and save the file in your server location. Here, the file is saved in /var/www/html/phpcode folder. A 3D bar chart with gradient effect will be created when the script runs. 12 months sales records are presented in the chart. An array is used here to store the dummy data of the chart. The height and width of the graph is defined when object of phpgraphlib class is created. createGraph() method is called to display the chart in the browser.
include(‘../phpgraphlib/phpgraphlib.php’);
$chart = new PHPGraphLib(600,450);
$data = array(100, 500, 250, 900, 750, 230, 159, 820,645,129,923,312);
$chart->addData($data);
$chart->setTitle(‘Monthly Sales Report’);
$chart->setGradient(‘blue’, ‘green’);
$chart->createGraph();
?>
Output:
The following output will show when you run the script from the server.
http://localhost/phpcode/chart1.php
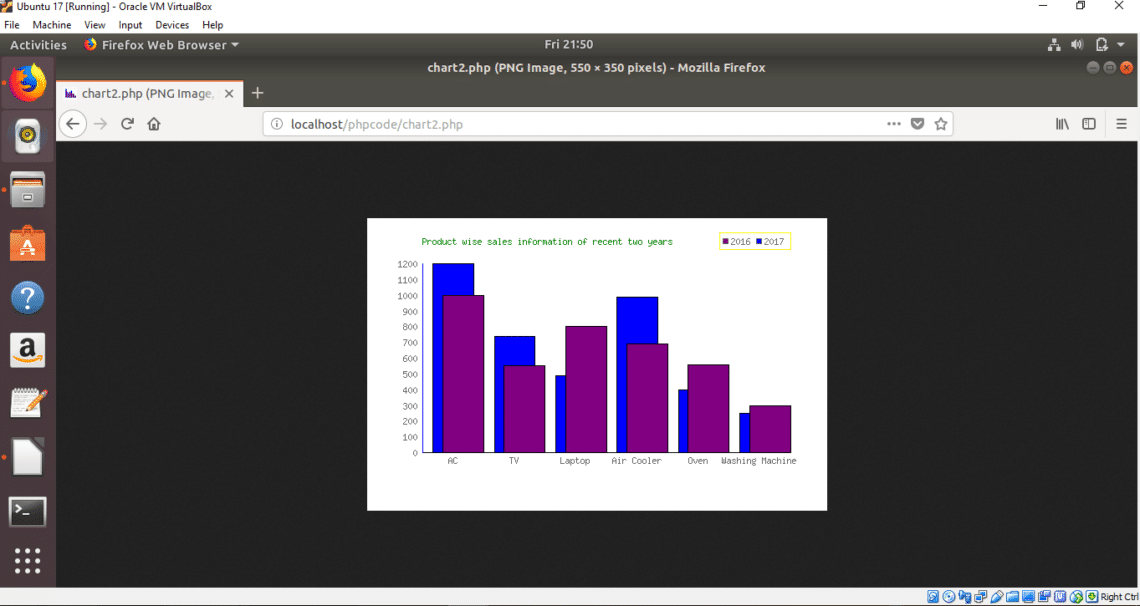
Example-2: Creating 3D bar chart using two sets of data
Write the following script and save the file in the previous location. Two data arrays are used in the script to store sales records of different electronics products for two consecutive years. The growth of any company can be analyzed by creating this type of chart. How you can customize the looks of the chart by using various methods of phpgraphlib class is also shown in this script.
include(‘../phpgraphlib/phpgraphlib.php’);
$graph=new PHPGraphLib(550,350);
$d1=array("AC" => 1000, "TV" => 550, "Laptop" => 800,"Air Cooler" => 690,
"Oven" => 560, "Washing Machine" => 300);
$d2=array("AC" => 1200, "TV" => 740, "Laptop" => 490,"Air Cooler" => 990,
"Oven" => 397, "Washing Machine" => 250);
$graph->addData($d1, $d2);
$graph->setBarColor(‘purple’, ‘blue’);
$graph->setTitle(‘Product wise sales information of recent two years’);
$graph->setupYAxis(12, ‘blue’);
$graph->setupXAxis(20);
$graph->setGrid(false);
$graph->setLegend(true);
$graph->setTitleLocation(‘left’);
$graph->setTitleColor(‘green’);
$graph->setLegendOutlineColor(‘yellow’);
$graph->setLegendTitle(‘2016’, ‘2017’);
$graph->setXValuesHorizontal(true);
$graph->createGraph();
?>
Output:
The following output will show when you run the script from the server.
http://localhost/phpcode/chart2.php
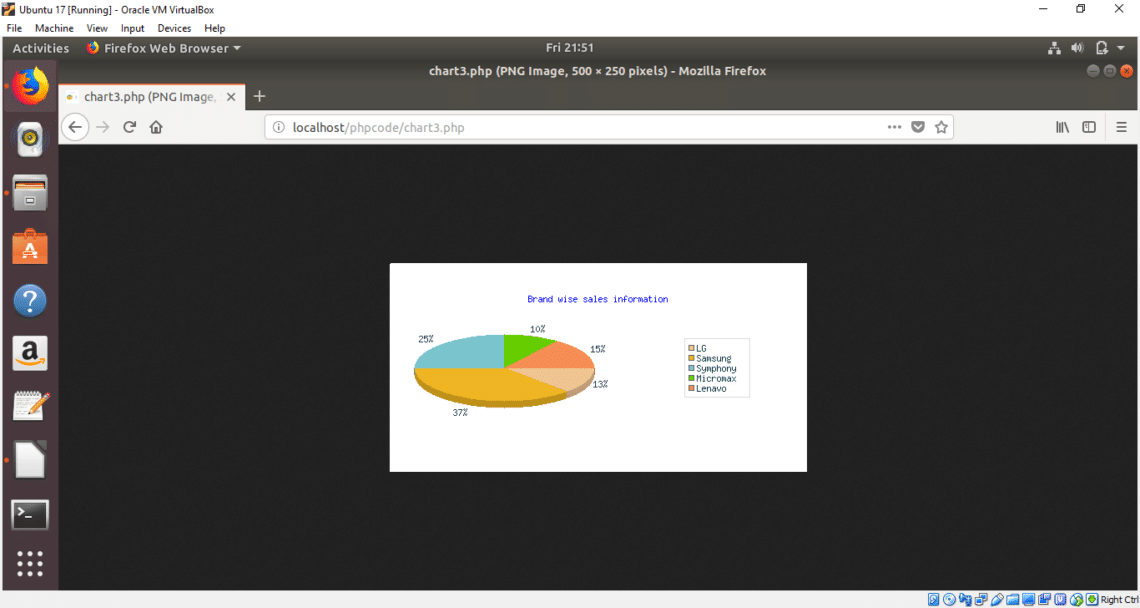
Example-3: Creating Pie Chart
Write the following script and save the file in previous location. For creating pie chart, you have to use another class PHPGraphLibPie. This script has used to show the brand wise sales information.
include(‘../phpgraphlib/phpgraphlib.php’);
include(‘../phpgraphlib/phpgraphlib_pie.php’);
$chart = new PHPGraphLibPie(500, 250);
$data = array("LG" => 13, "Samsung" => 37,"Symphony" => 25, "Micromax" => 10,
"Lenavo" => 15);
$chart->addData($data);
$chart->setTitleColor(‘Blue’);
$chart->setTitle(‘Brand wise sales information’);
$chart->setLabelTextColor(‘35,55,75’);
$chart->setLegendTextColor(‘15,59,67’);
$chart->createGraph();
?>
Output:
The following output will show when you run the script from the server.
http://localhost/phpcode/chart3.php
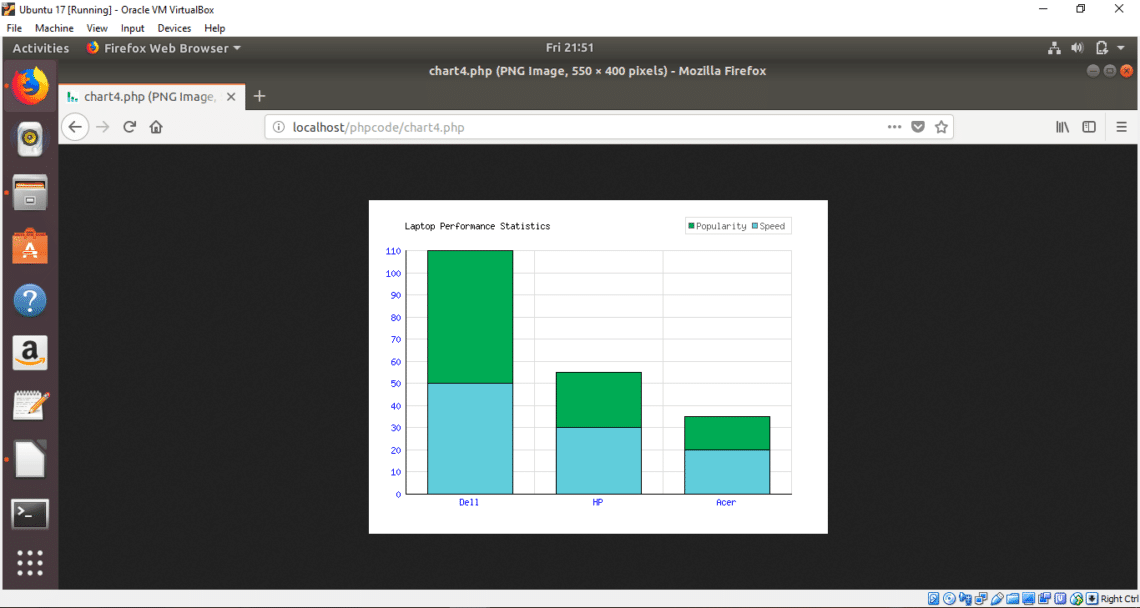
Example-4: Creating Stacked Chart
Write the following script and save the file in previous location. You have to use PHPGraphLibStacked class to create stacked chart. This following script will create brand wise popularity and speed of laptop using stacked chart. Here, the records of three brands are added in two arrays which are used to create stacked chart.
include(‘../phpgraphlib/phpgraphlib.php’);
include(‘../phpgraphlib/phpgraphlib_stacked.php’);
$graph = new PHPGraphLibStacked(550,400);
$popularity = array(‘Dell’=>60, ‘HP’=>25, ‘Acer’=>15);
$speed = array(‘Dell’=>50, ‘HP’=>30, ‘Acer’=>20);
$graph->addData($popularity, $cost, $speed);
$graph->setTitle(‘Laptop Performance Statistics’);
$graph->setTitleLocation(‘left’);
$graph->setXValuesHorizontal(TRUE);
$graph->setTextColor(‘blue’);
$graph->setBarColor(‘#00ab55’, ‘#60cdda’);
$graph->setLegend(TRUE);
$graph->setLegendTitle(‘Popularity’, ‘Speed’);
$graph->createGraph();
?>
Output:
The following output will show when you run the script from the server.
http://localhost/phpcode/chart4.php
Many other class files are available in this library to create different types of charts. All data used in the above examples are static. You can easily fetch data from the database server using PHP and use them for creating charts based on dynamic data. If you want to create more attractive chart and faster download then you can use any popular client-side library. Canvas.js, Fusioncharts, AmCharts etc. are client-side libraries to create beautiful animated chart by using server side.