Overview
Chrome DevTools are an excellent set of tools built directly into the most popular Web Browser, Google Chrome. The best thing about the Chrome DevTools is that these are really easy to use and must have for Web Developers today. From diagnosing common issues you’re facing in your project to tracking the speed and performance of each component of your application, Chrome DevTools can help you get a very deep insight about how your project is performing. Everything for free!
In this lesson, we will take a look at what all DevTools are present in the Google Chrome browser.
Chrome DevTools
Chrome DevTools are a really powerful set of tools. With these tools, it is even possible to modify websites you don’t own for a specific session itself. Let’s try to change the Google website colour. Open the DevTools with Cmd + Shift + C and add a background color in body:
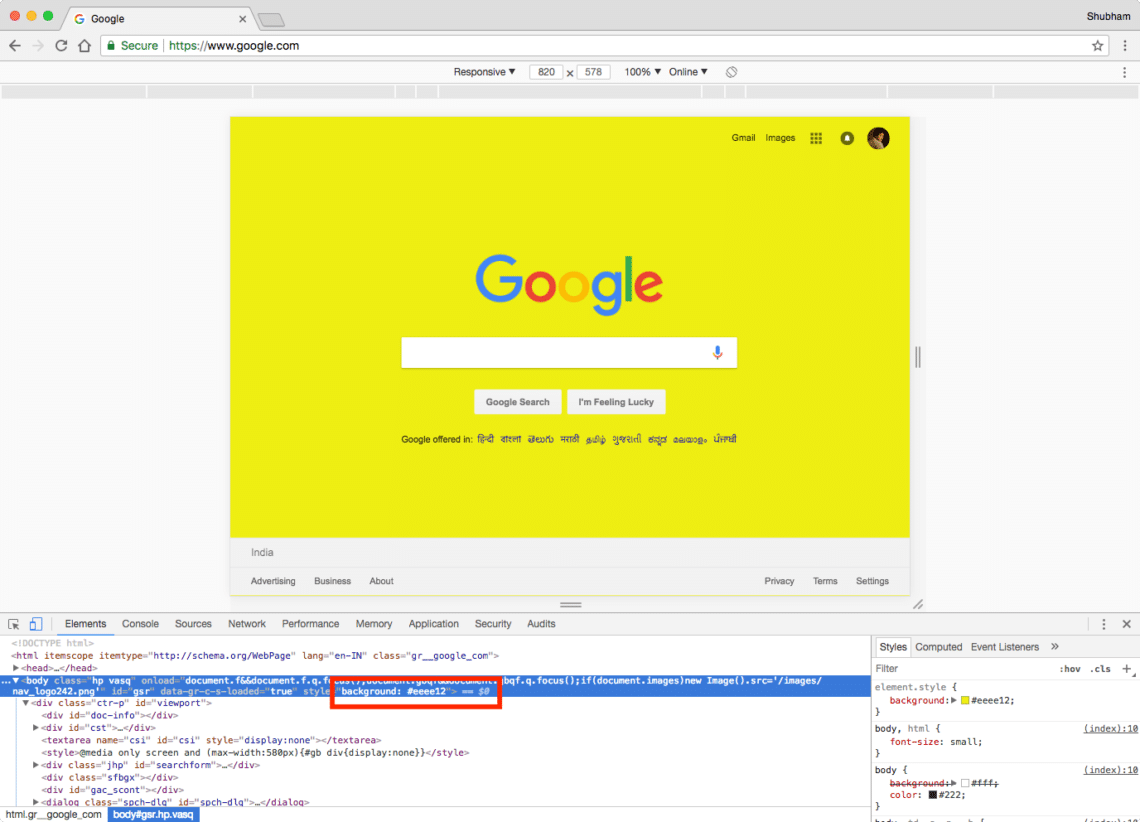
Adding background color
Now, when we close the DevTool window, we can see the effect:
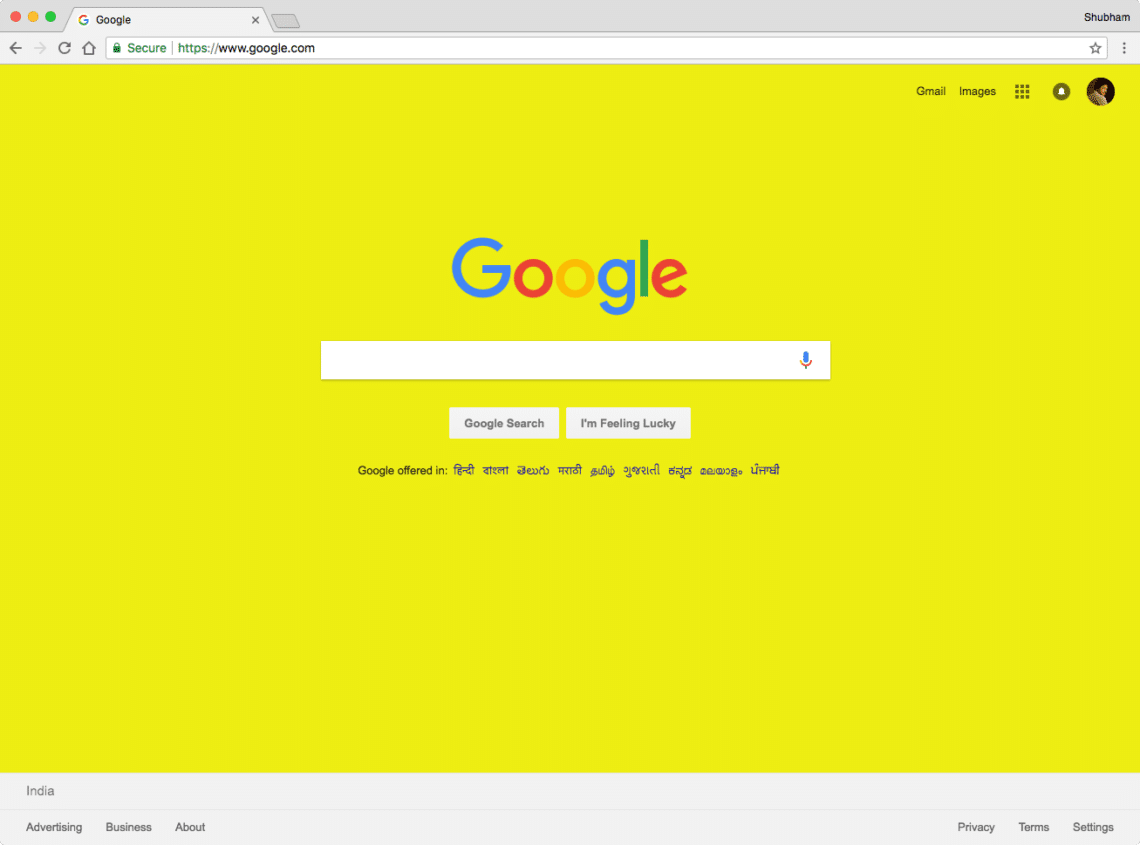
Google Color update
Let’s try these tools now.
Installation
A very good thing about Chrome DevTools is that you don’t have to install anything apart from a regular web browser i.e. Google Chrome. If you have that already, excellent, you’re ready to start straight away!
Viewing And Changing CSS
To start with, we will begin by just modifying an element’s CSS. We will start with LinuxHint’s elements itself. Here, we right click on one of H1 tags to find the inpect option:
Finding inspect option
Next, when the source for this element is highlighted, we can edit the CSS properties simply by editing the source:
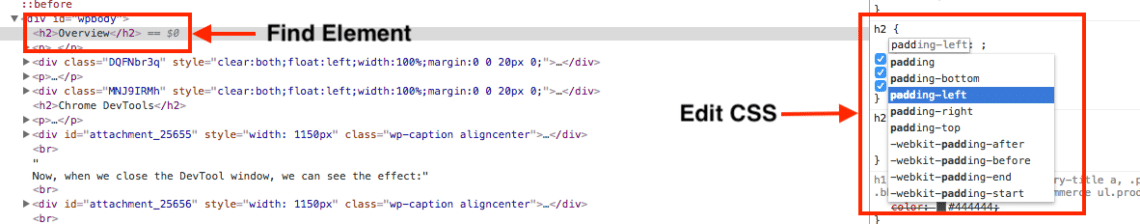
Edit element CSS
As soon as you hit enter, the CSS will be applied to the selected element.
Debugging JavaScript
In every programming language, most developers learn to code and debug their programs by adding a lot of print statements to see what output their code is producing and what path it is following. In JS, we use console.log() commands for the same purpose.
We will make use of a sample project on Google Chrome Github repository. Click here to open this demo in new tab, followed by which open DevTools with Cmd + Shift + C. Once the console is open, it will look like:
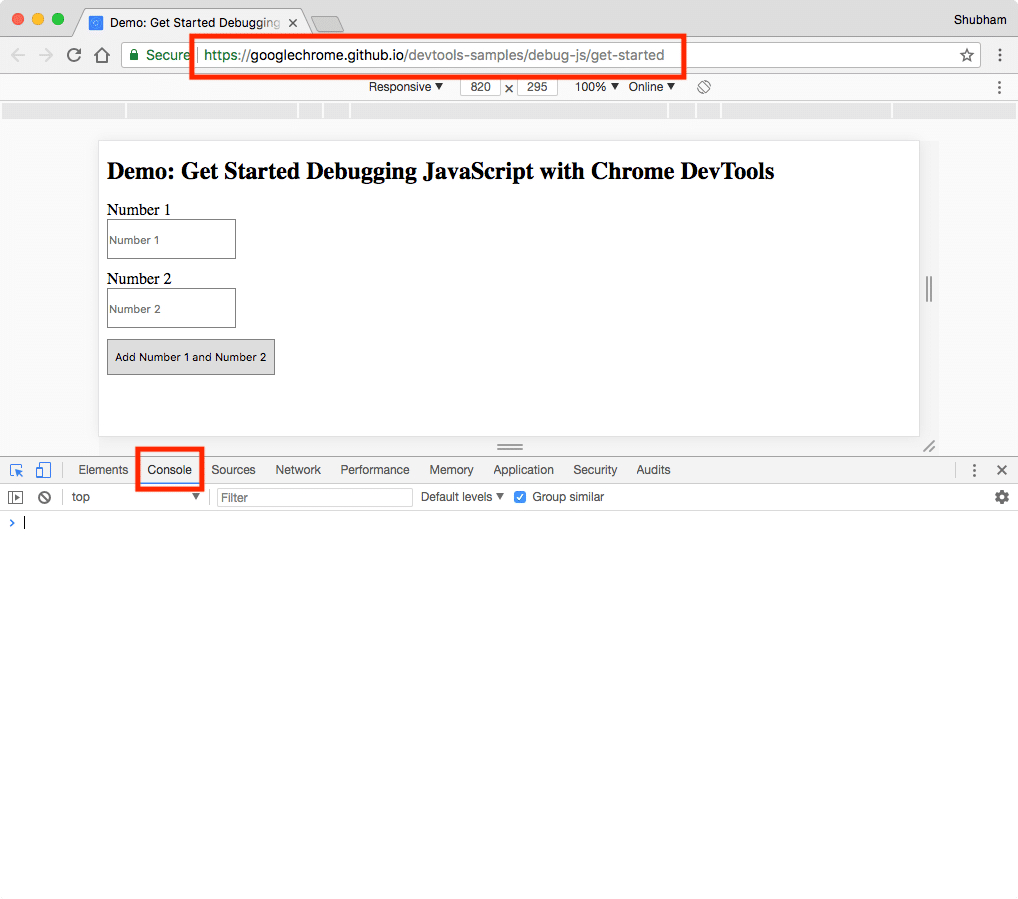
JS Console
On the sources tab, we can even see the JS source for the JS.
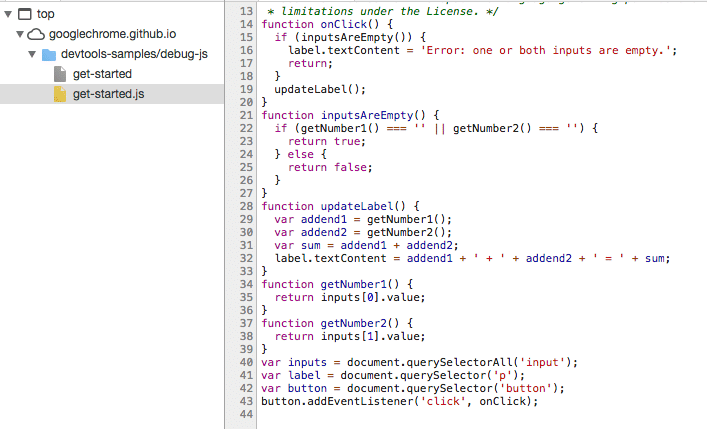
JavaScript Source
If you try the number addition right now, you’ll see that results are incorrect. Let us add a breakpoint in the program:
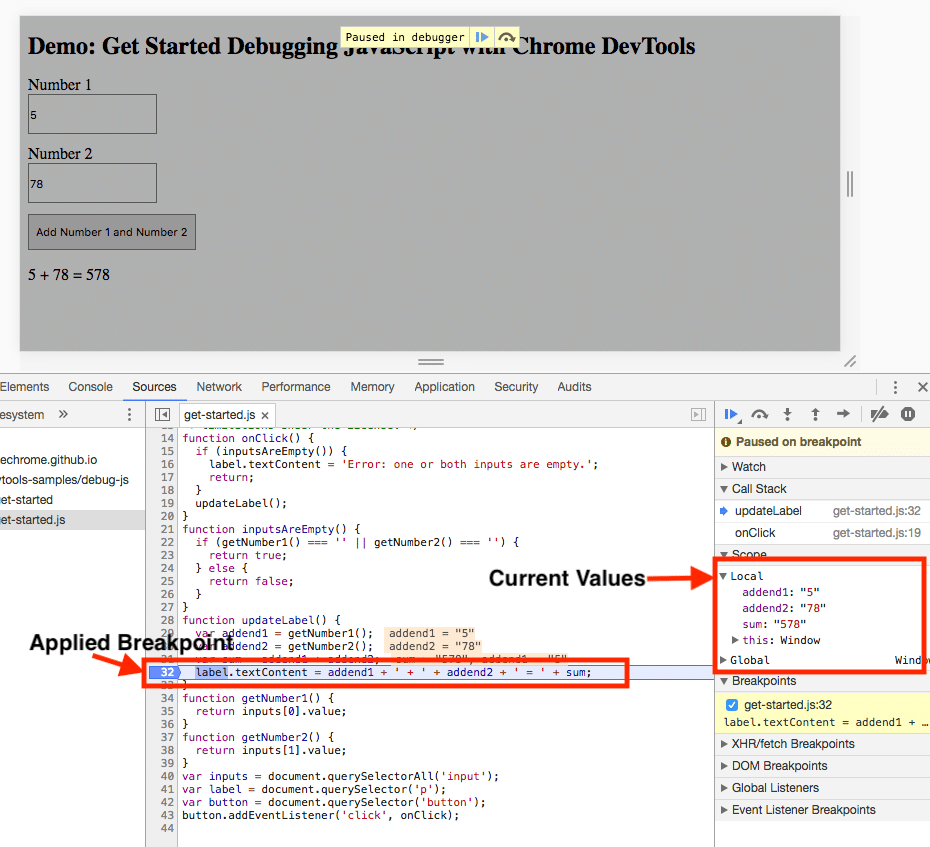
Using breakpoints
You can even use the JS console provided to print the values available in the proghram right now. This is how JS Source and Console makes it so easy to run, debug and modify JS programs with the help of Chrome DevTools.
Running JavaScript Console
JavaScript Console is another awesome tool to debug JavaScript source. It has two main uses:
- Viewing data about the page which was embedded by the original web developer to see diagnostic information
- Running JavaScript. We can run JavaScript on the console and actually modify the DOM of the page by the code we write!
To make use of this tool, just open any webpage or the one you defined, like Stackoverflow Android questions page. When you open any page, you will see messages like these:
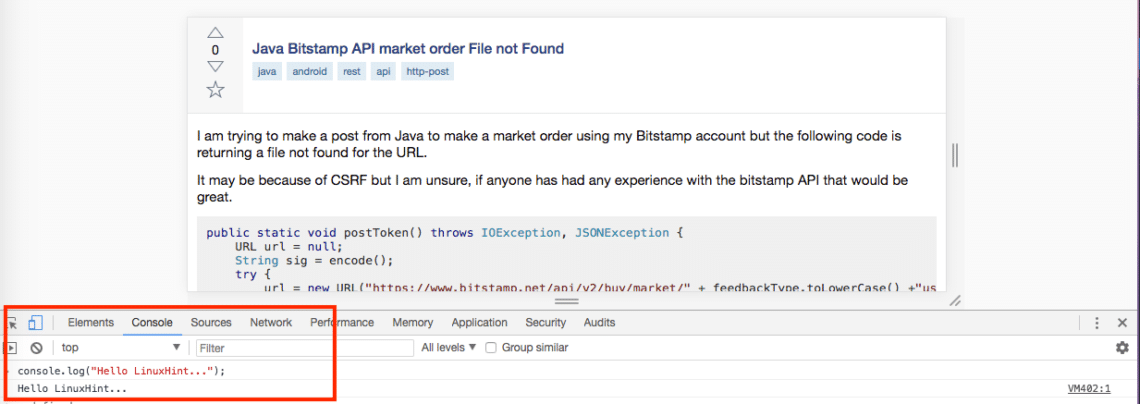
Console Messages
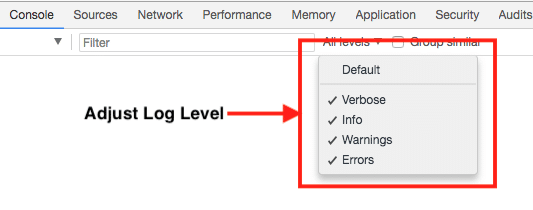
We can even adjust message log level to only see the messages we’re currently interested in:
Console messages level
Analyzing Runtime performance
Above were some simple uses for the Chrome DevTools. With them, we can even track performance for the page. We can switch to the Performance tab and start recording the performance profile:
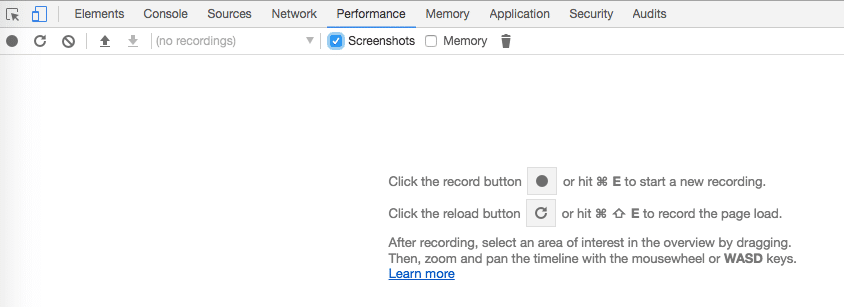
Start Performance tracking
Visit any page you like and hit the mentioned button. Once you’re done with profiling, hit the stop button and you will be presented something like this:
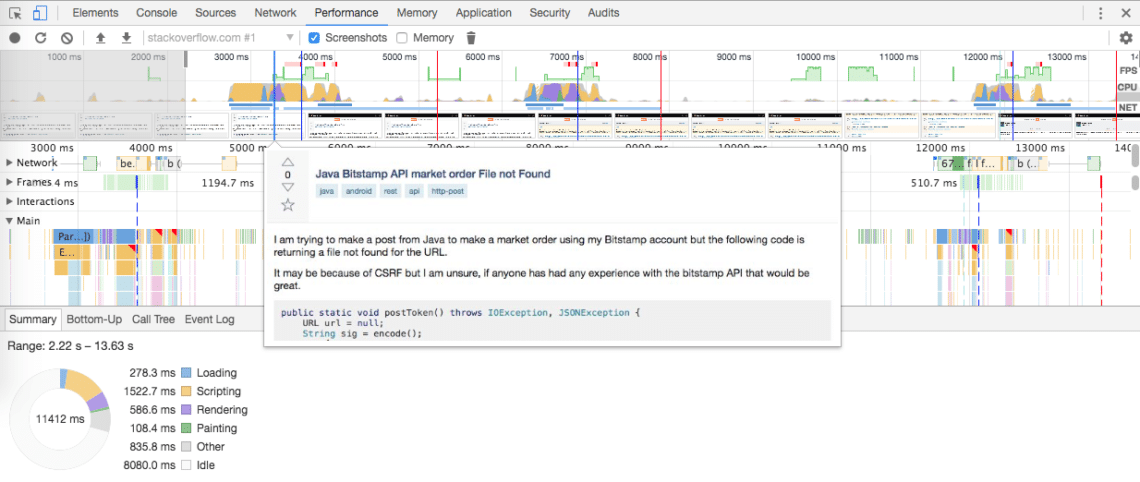
Page Performance
We can even select a snapshot of the performance about what was the page doing and how was its performance at a particular instance when the page was switching to another link:
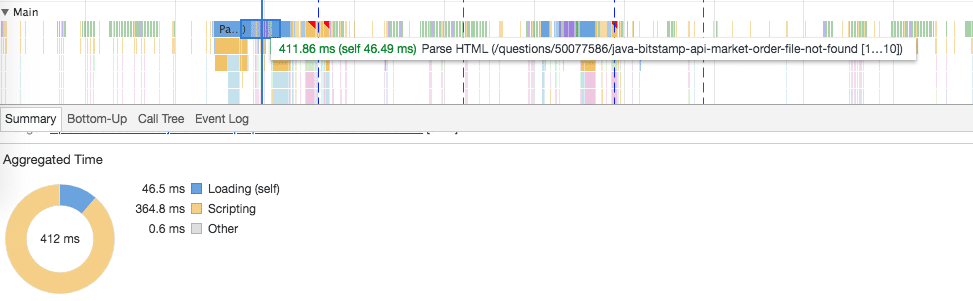
Snapshot for performance
We were even able to see at what time, the page was at which link and how much time it took for Loading and scripting purposes. This way, we can have a deeper insights about how much time our client scripts are taking and if there are some blockages due to which page rendering is slow.
Conclusion
In this lesson, we looked at how we can use Chrome DevTools to track the performance for our web applications and perform debugging in much more efficient way.